Guide to Reading and Using Karte
Oct 6, 2026
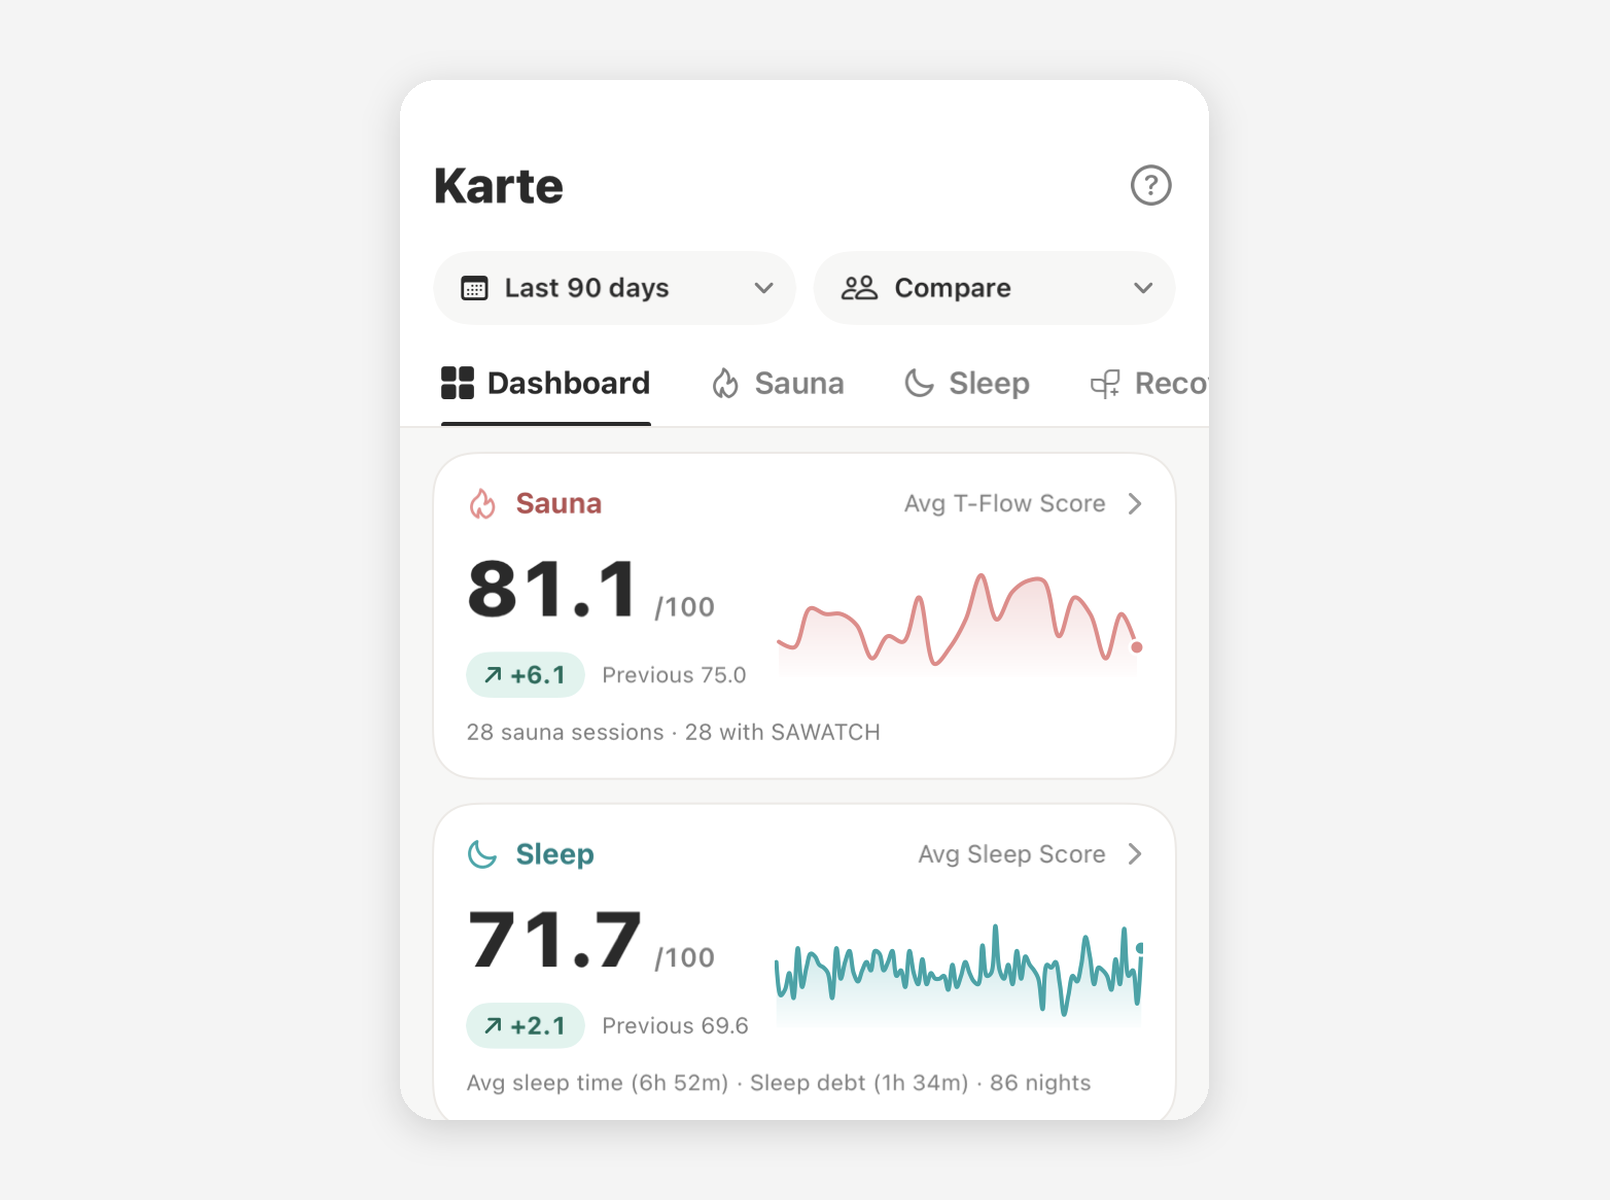
In Totonoi Karte, you can review your records from Totonoi Log, Sleep Log, and sauna device all in one place!
Check the trends of your T-Flow Score and Sleep Score in graphs, see what affected your scores, and find the sauna style that suits you best.
Here, we explain how to read each screen of Totonoi Karte! You can also open this page anytime from the "?" icon in the top right corner of the Totonoi Karte screen.
■ Select Period
You can select the aggregation period from the period button in the top right corner of the screen. Initially, it is set to "Past 90 days".
- Past 30 days, Past 60 days, Past 90 days
- Half year, 1 year, All time, Custom range (🔓 Premium Plan)
The graph intervals automatically adjust according to the selected period. Shorter periods are shown per session (per day), up to about half a year shows weekly averages, and longer periods show monthly averages.
■ Dashboard
You can check summaries of Sauna, Sleep, Recovery, and Activity on a single screen. Tap a card to move to its respective karte.
- Sauna: Average T-Flow Score
- Sleep: Average Sleep Score and average sleep duration
- Recovery: Average Recovery
- Activity: Average step count and average calories burned
Each card also displays the difference compared to the previous period of the same length.
Below the cards, you can also check the following details:
- What worked: Conditions that increased and decreased your T-Flow Score and Sleep Score the most
- Changes after sauna: The difference in Sleep Score between sleep after a sauna session and other sleep. Shows how many hours after a sauna session you went to sleep on the night with the highest score.
- Step count and that night's sleep: Average Sleep Score for each step count category
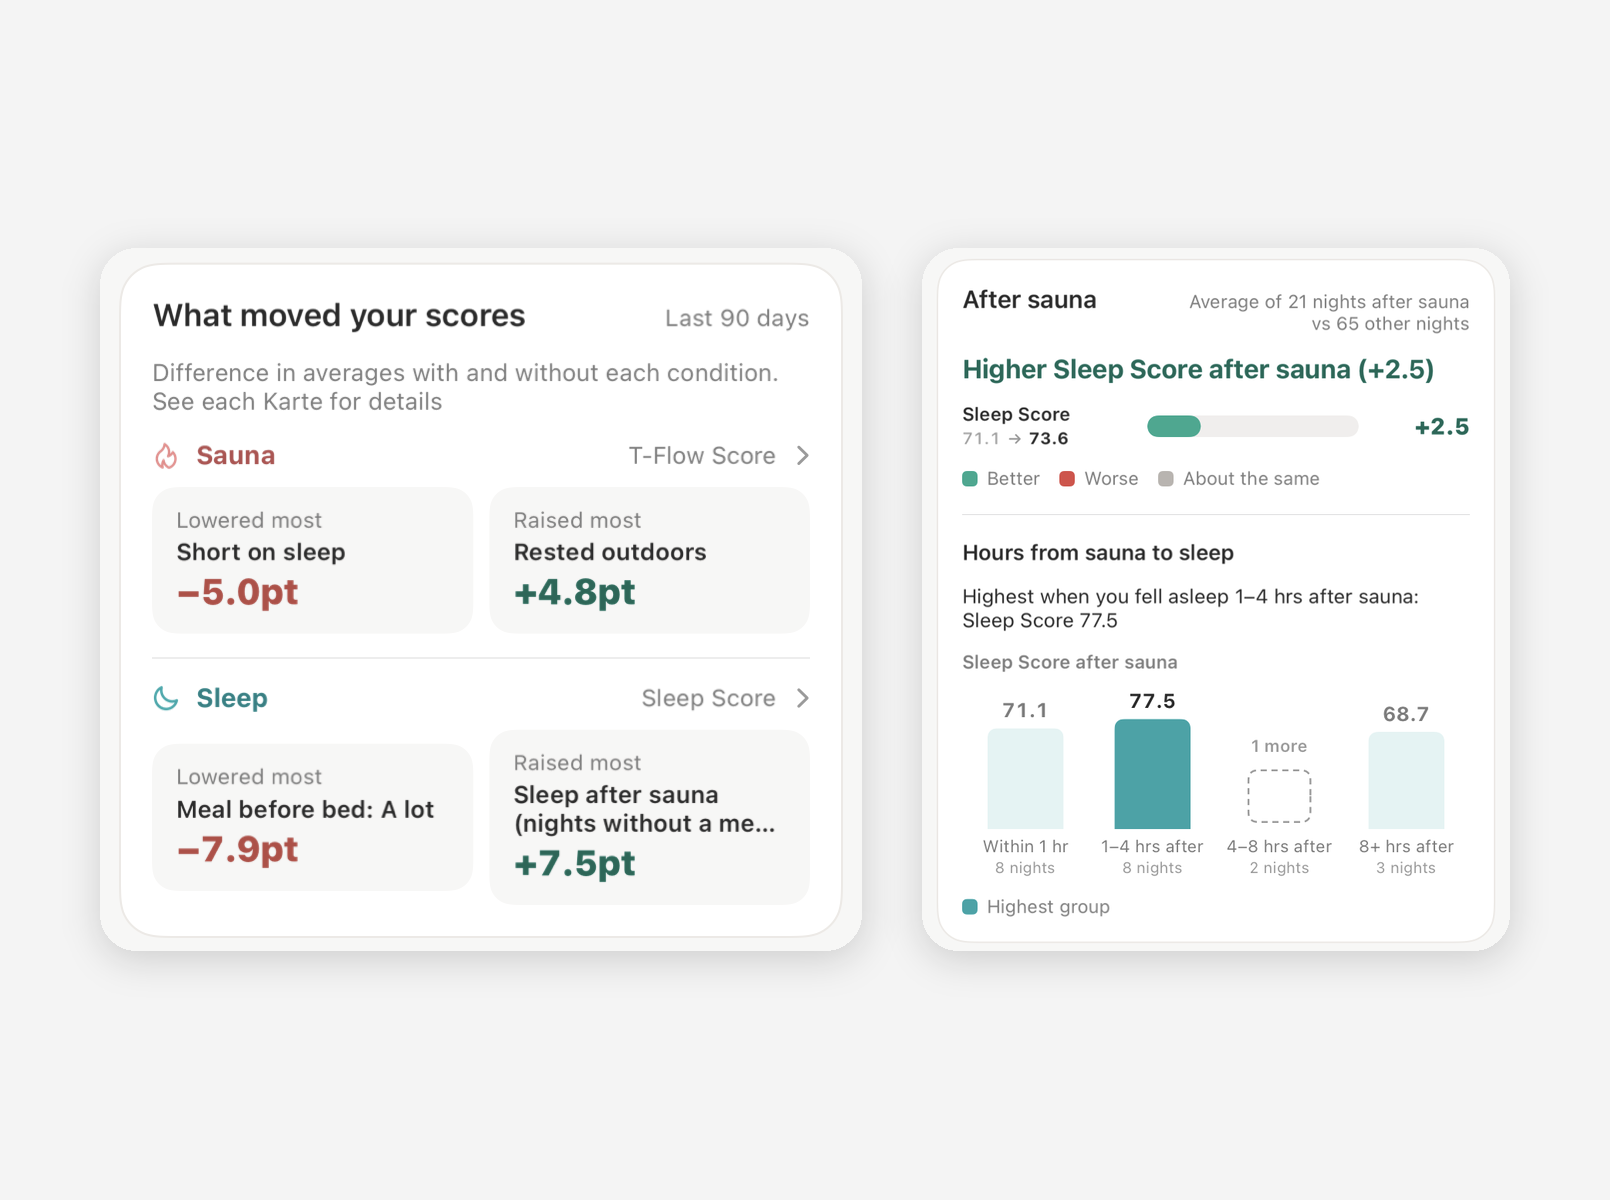
💡 "Sleep after a sauna session" refers to sleep that started within 12 hours after finishing a sauna session.
■ Sauna Karte
□ Score Trend
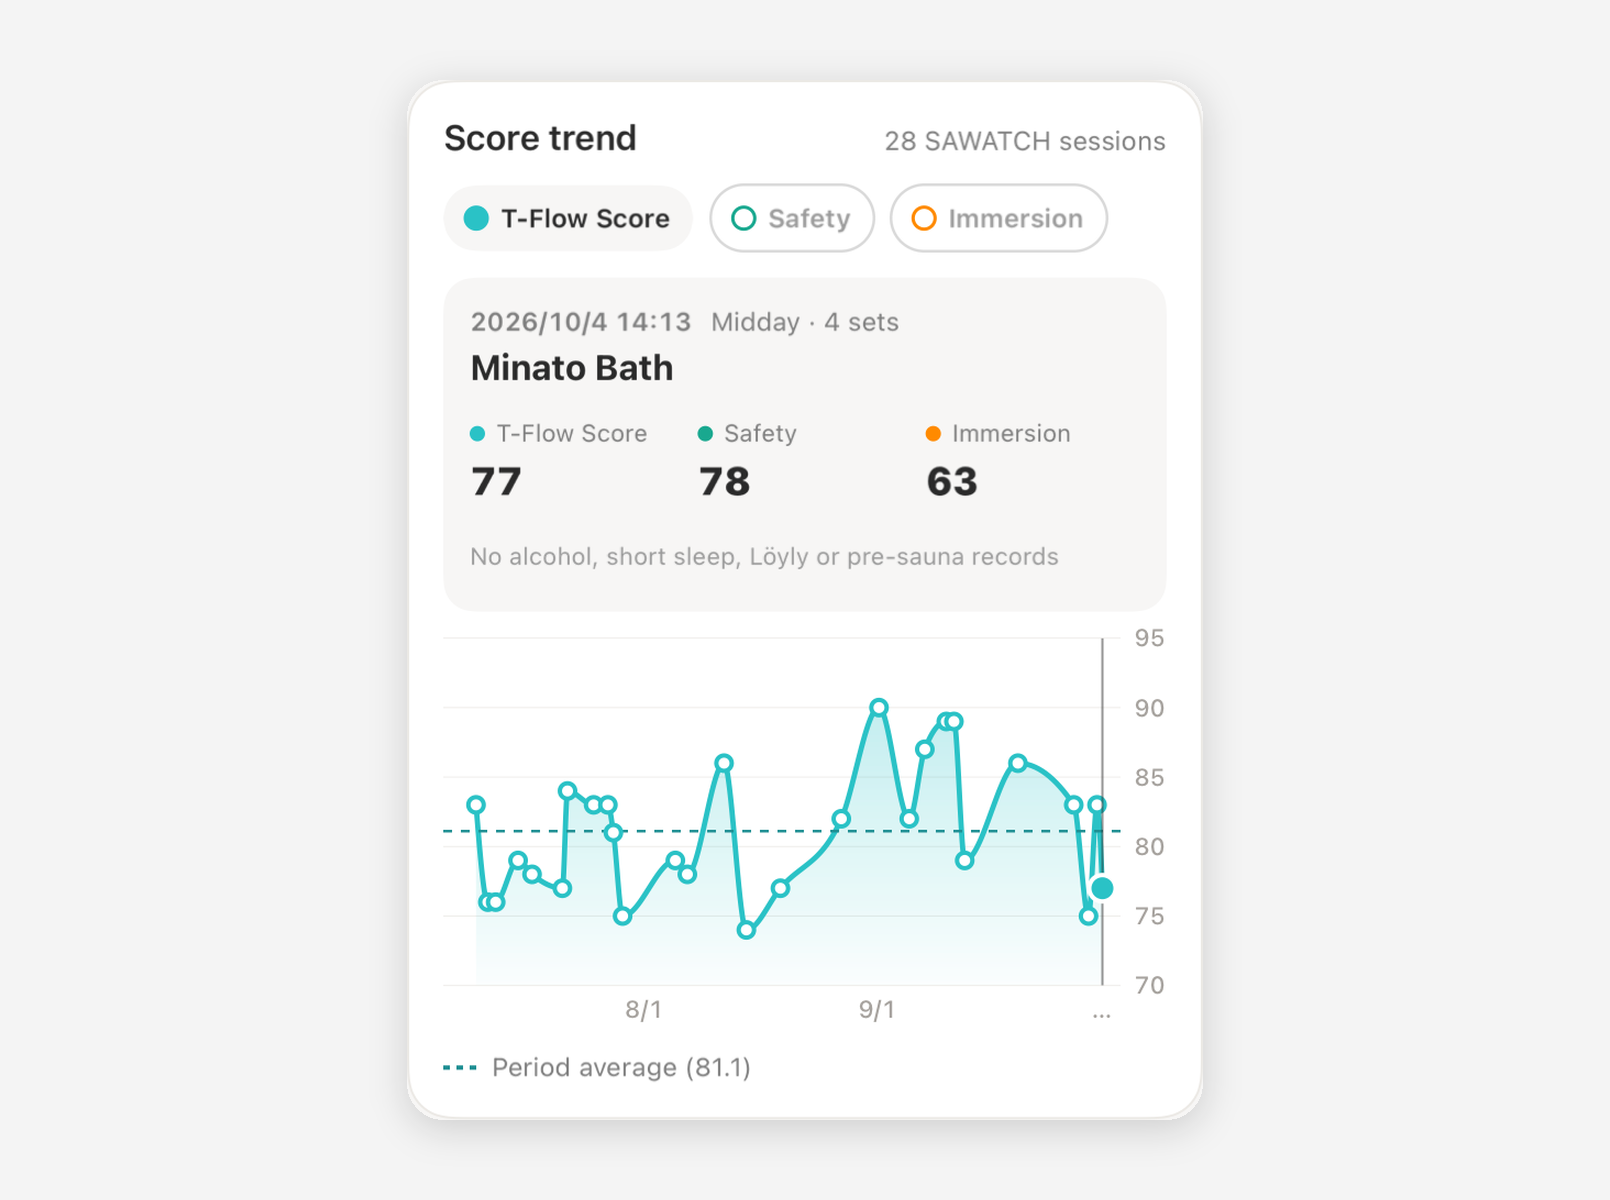
This shows the trend of T-Flow Score for sauna sessions measured with the sauna device. Pressing "Safety" or "Immersion" overlays the lines for Safety Score and Immersion Score. Tapping a point on the graph allows you to check details for that session, such as the time of day, number of Sets, facility, and whether alcohol or loyly were involved.
□ What Affected T-Flow Score
This compares differences in T-Flow Score across conditions, such as pre-sauna session notes (physical condition, fatigue, alcohol, caffeine, workout, bathing, etc.), time of day, day of the week, number of Sets, and sleep before the sauna.
Duration and subjective feel of the sauna room, cold bath, and rest, as well as rest posture and location, are compared for each Set (🔓 Premium Plan only). Please refer to "■ How to Read What Affected Score" below for details.
□ Reflection Note Trends
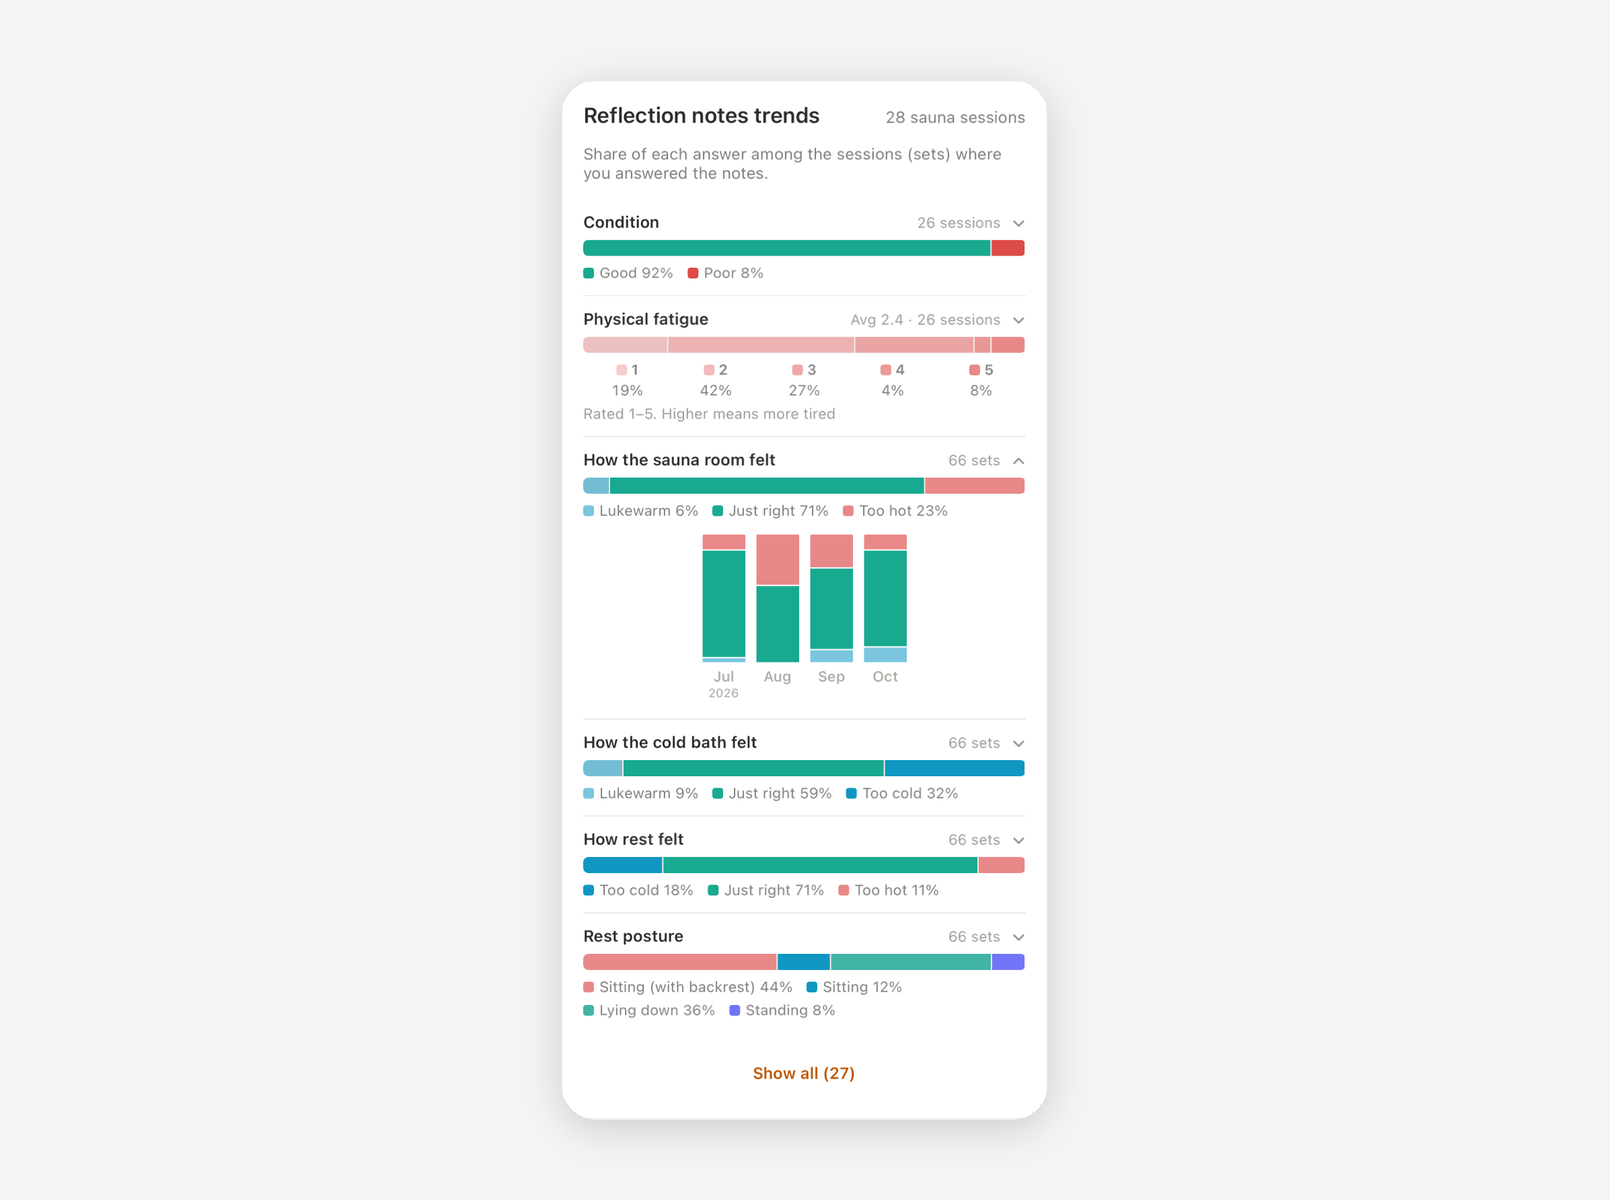
Displays the proportion of your answers in the pre-sauna session survey and reflection notes for each Set. It helps you understand your habits, including physical condition, fatigue, subjective feel, and posture in the sauna room, cold bath, and rest area. Tapping an item lets you view monthly trends.
🔓 With the Premium Plan, selecting a comparison target will display the comparison target's proportions side-by-side.
□ T-Flow Score Distribution
Displays the count of T-Flow Scores categorized into 10-point increments. It also shows the median and the counts for scores 80 and above versus under 80.
□ Time by Scene
Displays the median, shortest, and longest duration for the sauna, cold bath, and rest. If there are 3 or more Teacher AI analyses, the difference between the AI Recommended duration and actual duration is also displayed.
□ Heart Rate by Scene
You can check maximum and average heart rate in the sauna, minimum heart rate in the cold bath, and time until heart rate stabilizes during rest for each Set.
□ By Number of Sets / By Time of Day
🔓 Premium Plan Exclusive Feature
Categorized by the total number of Sets completed in a session or the time of day, this displays the session count and average T-Flow Score for each.
■ Sleep Karte
□ Sleep Score Trends
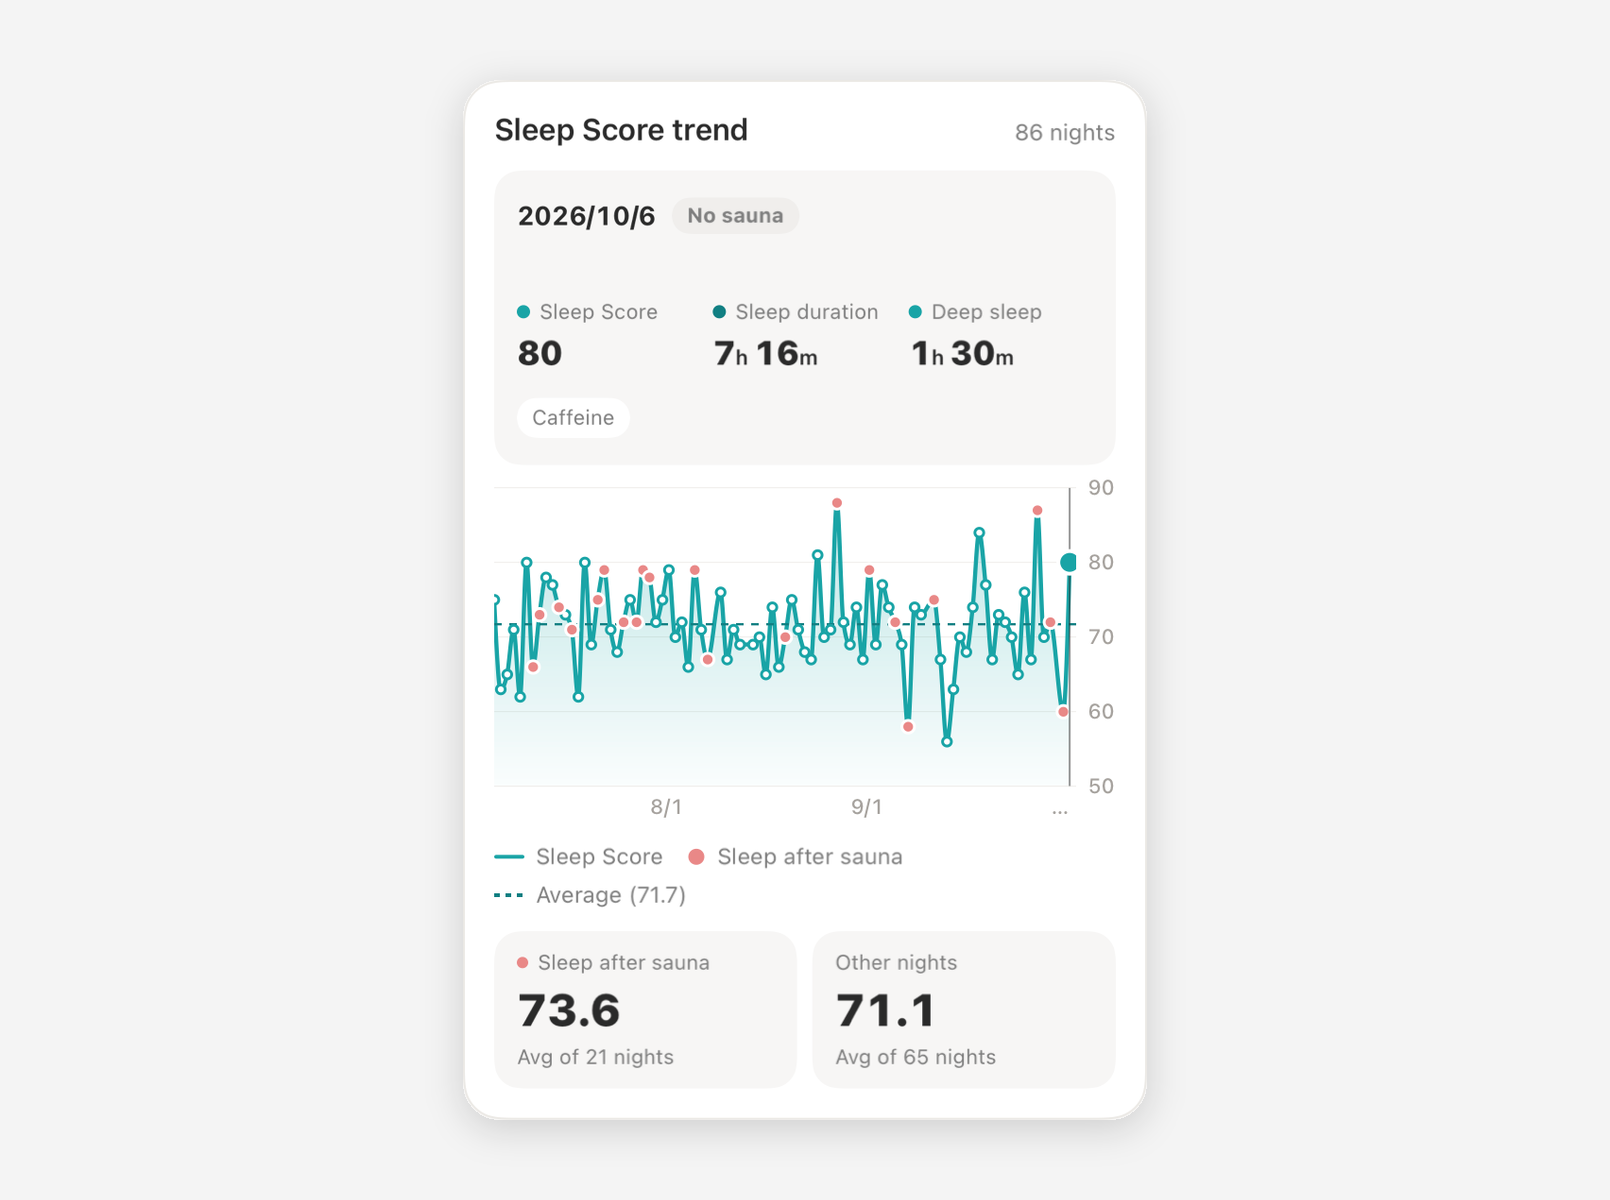
Sleep Log's Sleep Score trends. Sleep after a sauna session is marked, allowing you to compare the average sleep after a sauna session with other sleep. Tapping a point on the graph lets you check that night's sleep duration, deep sleep, and sleep memo details.
□ Factors Affecting Sleep Score
Differences in Sleep Score are displayed by condition, such as the time from a sauna session to falling asleep, alcohol, caffeine, exercise, and meals before bed (amount and how many hours before falling asleep they were completed), earlier or later bedtime than usual, day of the week, and step count for the day.
"Earlier or later bedtime than usual" refers to nights that deviate by 1 hour or more from your median bedtime during the period.
□ Sleep Memo Trends
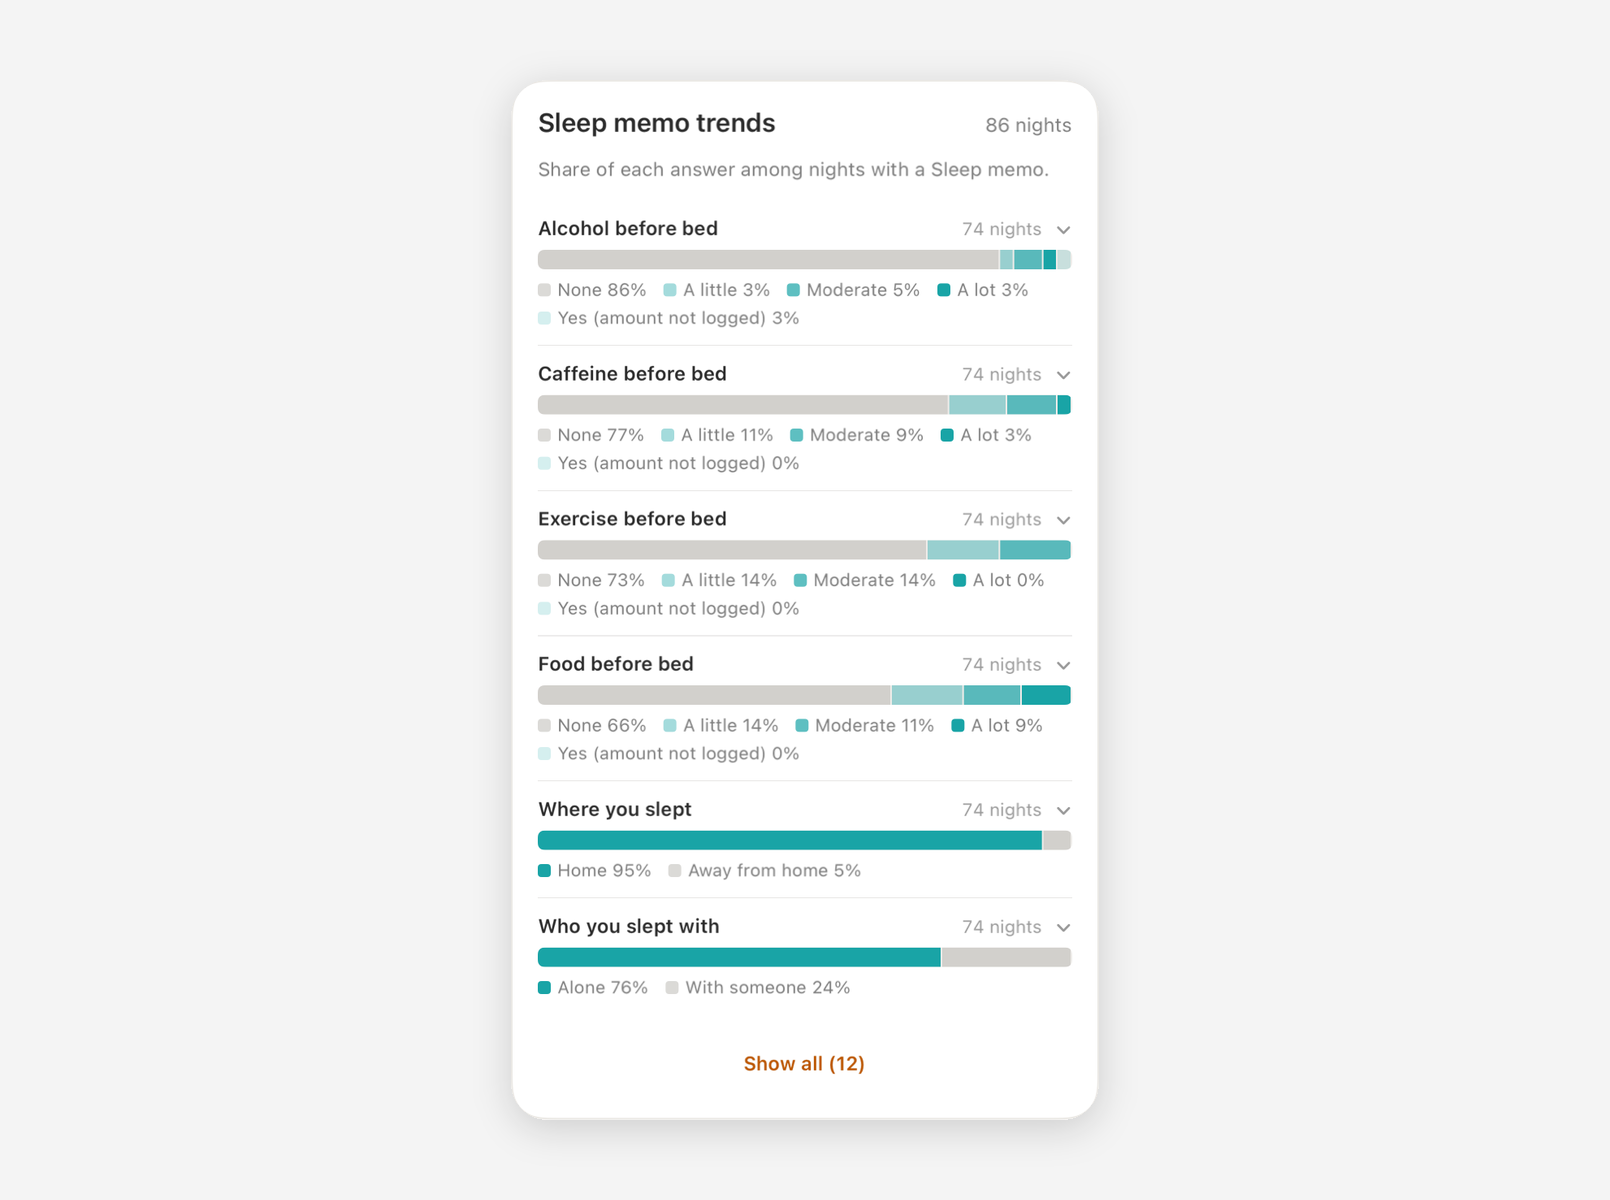
Displays the proportion of each response among nights where a sleep memo was completed. You can see the amount and end time of pre-bedtime alcohol, caffeine, exercise, and meals, as well as sleep location, who you slept with, and custom items. Tapping an item lets you check monthly trends.
□ Sleep Duration Breakdown
Displays deep sleep, light sleep, REM sleep, and awake time in a stacked bar graph.
□ Sleep Duration Trends
Displays trends in actual sleep duration.
🔓 In the Premium Plan, Sleep Need and Sleep Debt are also displayed. You can also see the percentage of times you met your Sleep Need and your current Sleep Debt.
💡 Sleep Need and Sleep Debt are displayed on SAWATCH-3.
□ Bedtime & Wake-up Time
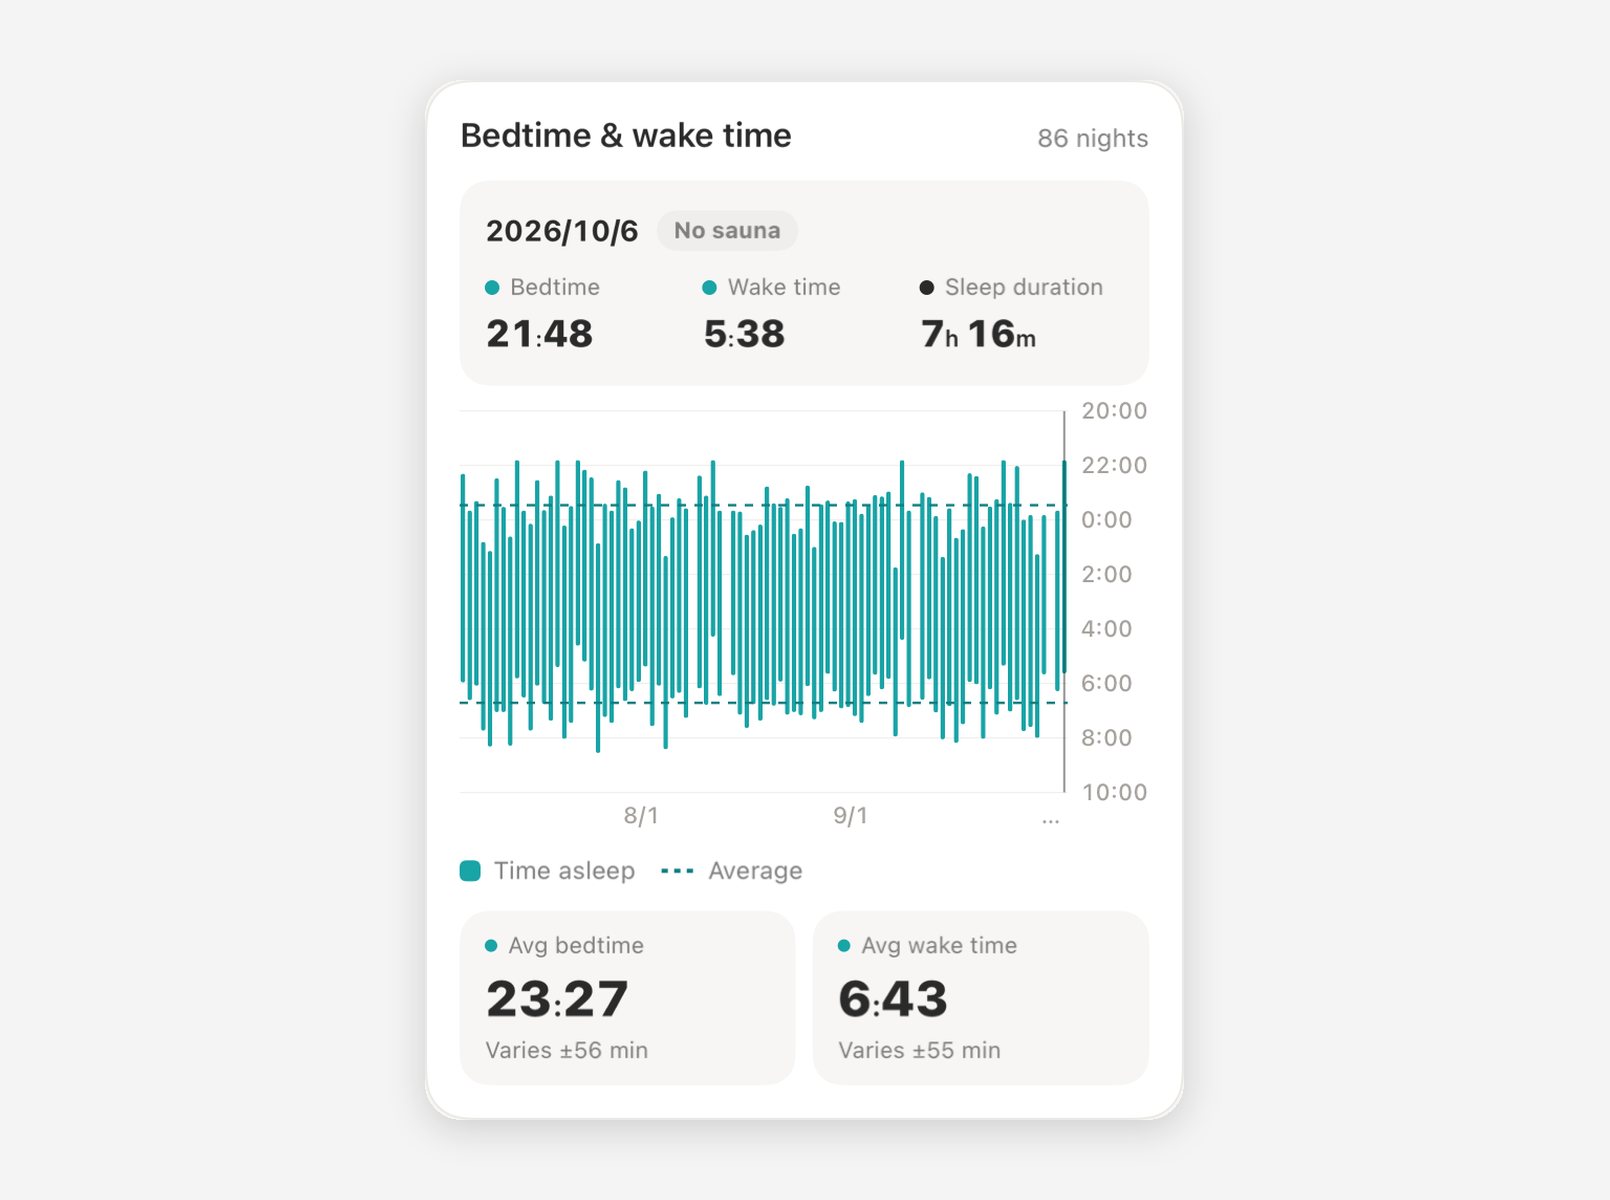
For the longest sleep of that day, vertical bars display the time from bedtime to wake-up time. You can also see the average bedtime and wake-up time for the period, along with their variance.
🔓 In the Premium Plan, selecting a comparison target overlays the median bedtime and wake-up time of the target.
■ Activity Karte
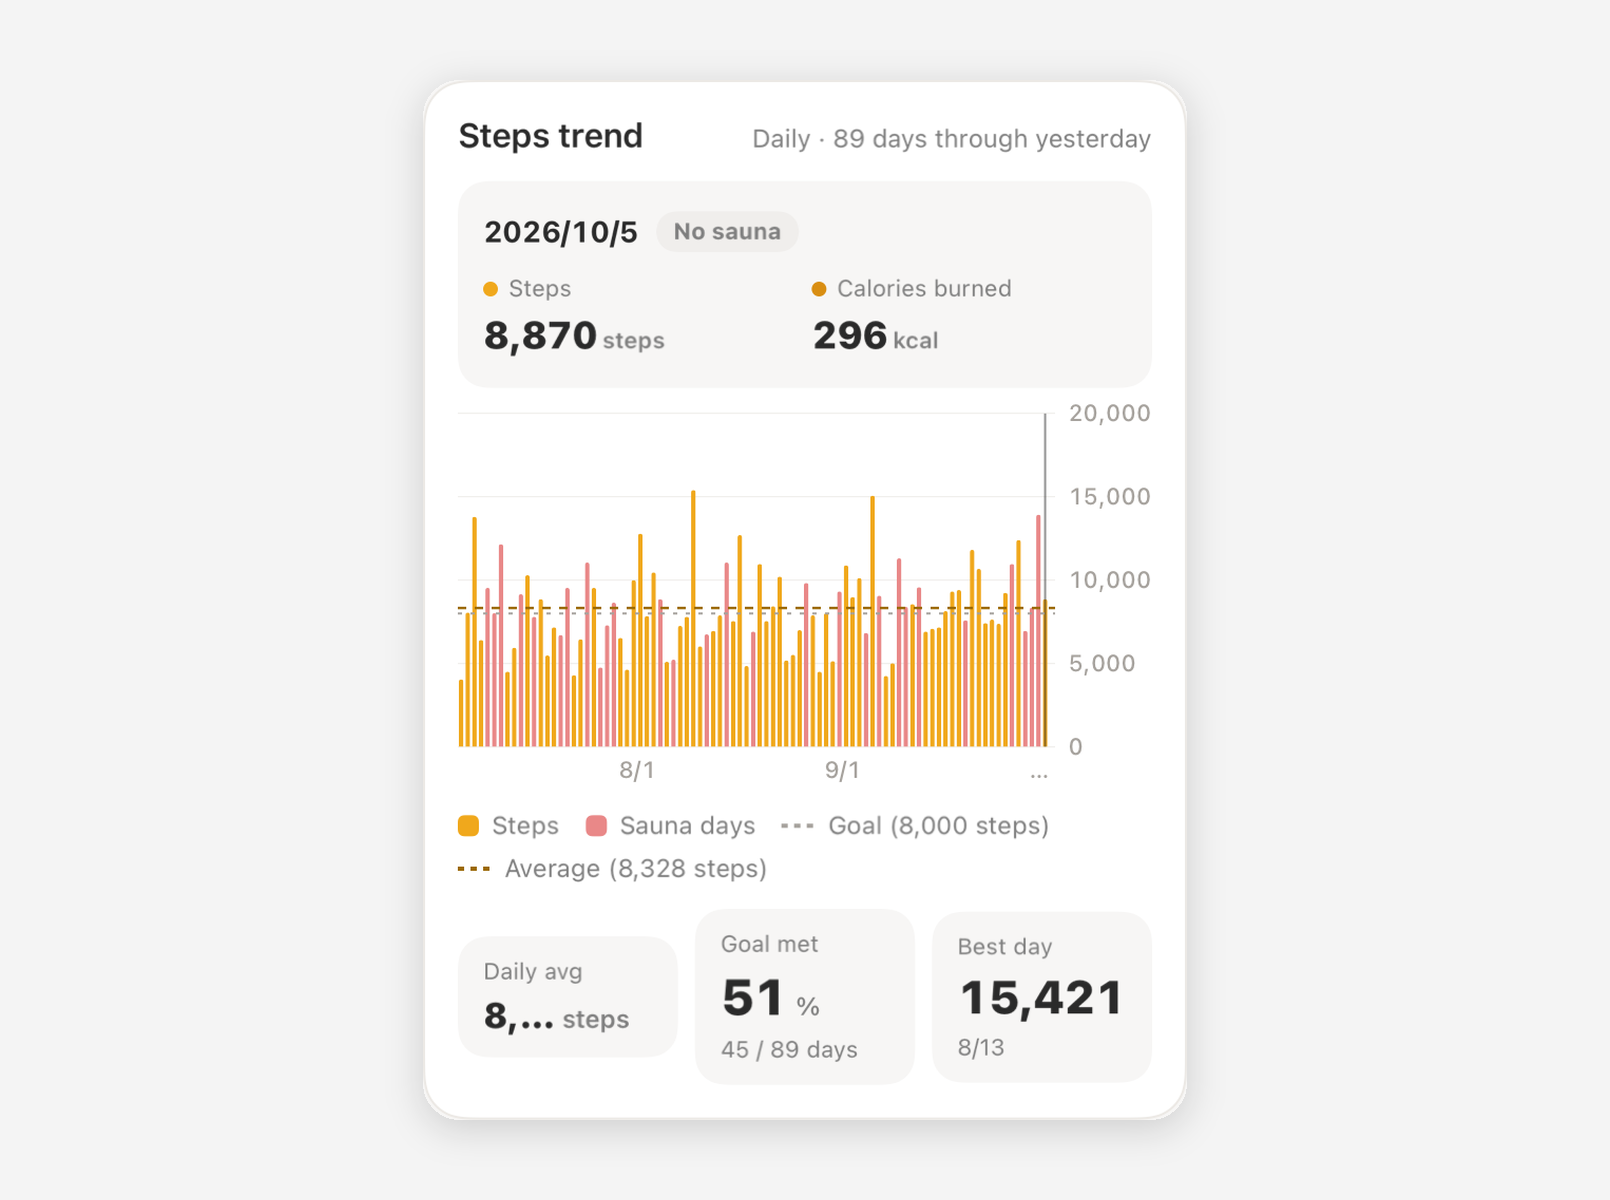
Step count and calories burned trends are displayed alongside your targets and period averages. You can also see average steps by day of the week. Since today's data is currently being calculated, records up to yesterday are shown.
💡 Step count and calories burned are measured with SAWATCH-3.
■ Recovery Karte
The Recovery Karte is currently in preparation. Until it is released, you can check your "Average Recovery" on the dashboard.
■ How to Read "What Worked"
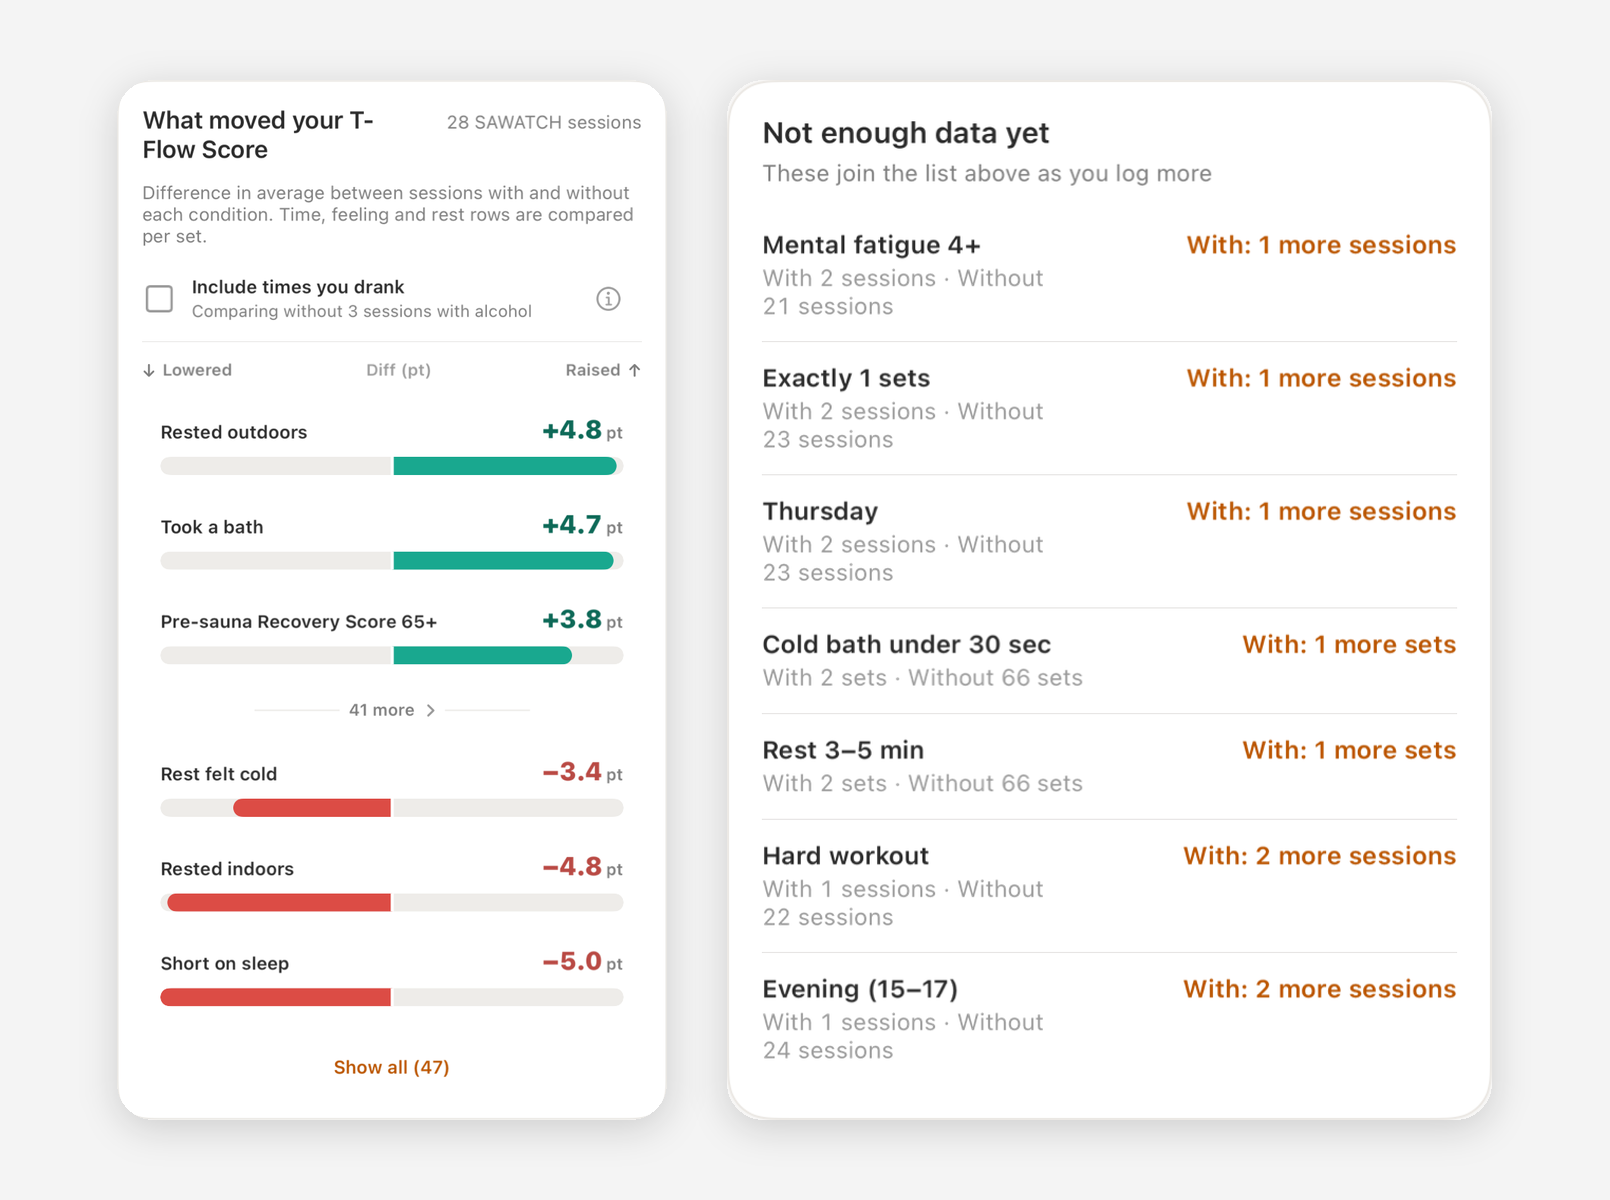
"What Worked" represents the difference in average score between sessions with and without that condition. Up to three conditions that increased or decreased the score are displayed in order of the size of the difference. Other conditions can be viewed under "N other items" or "Show all".
- Only conditions that occurred 3 or more times both with and without the condition are compared.
- Conditions with a difference of less than 1 point are displayed as "Almost the same".
- Tapping each row allows you to check the counts and averages for sessions with and without that condition.
- Conditions without enough count yet are shown under "Show all" under "Conditions requiring more records to compare", along with how many more times are needed.
□ Conditions by Set
🔓 Premium Plan Exclusive Feature
Duration and subjective feel in the sauna room, cold bath, and rest area, as well as rest posture and location, are compared using the T-Flow Score for each Set and counted by the number of Sets. This is because these vary by Set even within the same sauna session.
□ Include sessions with alcohol consumption
By default, sessions with alcohol consumption are excluded from comparison. This is because alcohol has a significant impact on scores, making differences in other conditions harder to see. Checking "Include sessions with alcohol consumption" compares sessions including those with alcohol. This checkbox is displayed only when there are alcohol-consumed sessions in the period.
- Sauna: Excludes sessions where alcohol was answered as "Yes" in the Pre-sauna Survey.
- Sleep: Excludes nights with heavy drinking, nights finished drinking within 4 hours of sleeping, and nights where amount or time was not recorded. Nights with light drinking or finished drinking early are always compared.
💡 "What Worked" is the difference in averages within your records. It does not necessarily mean that condition is the direct cause of the score. Trends will become clearer as you collect more records.
■ Compare with Everyone
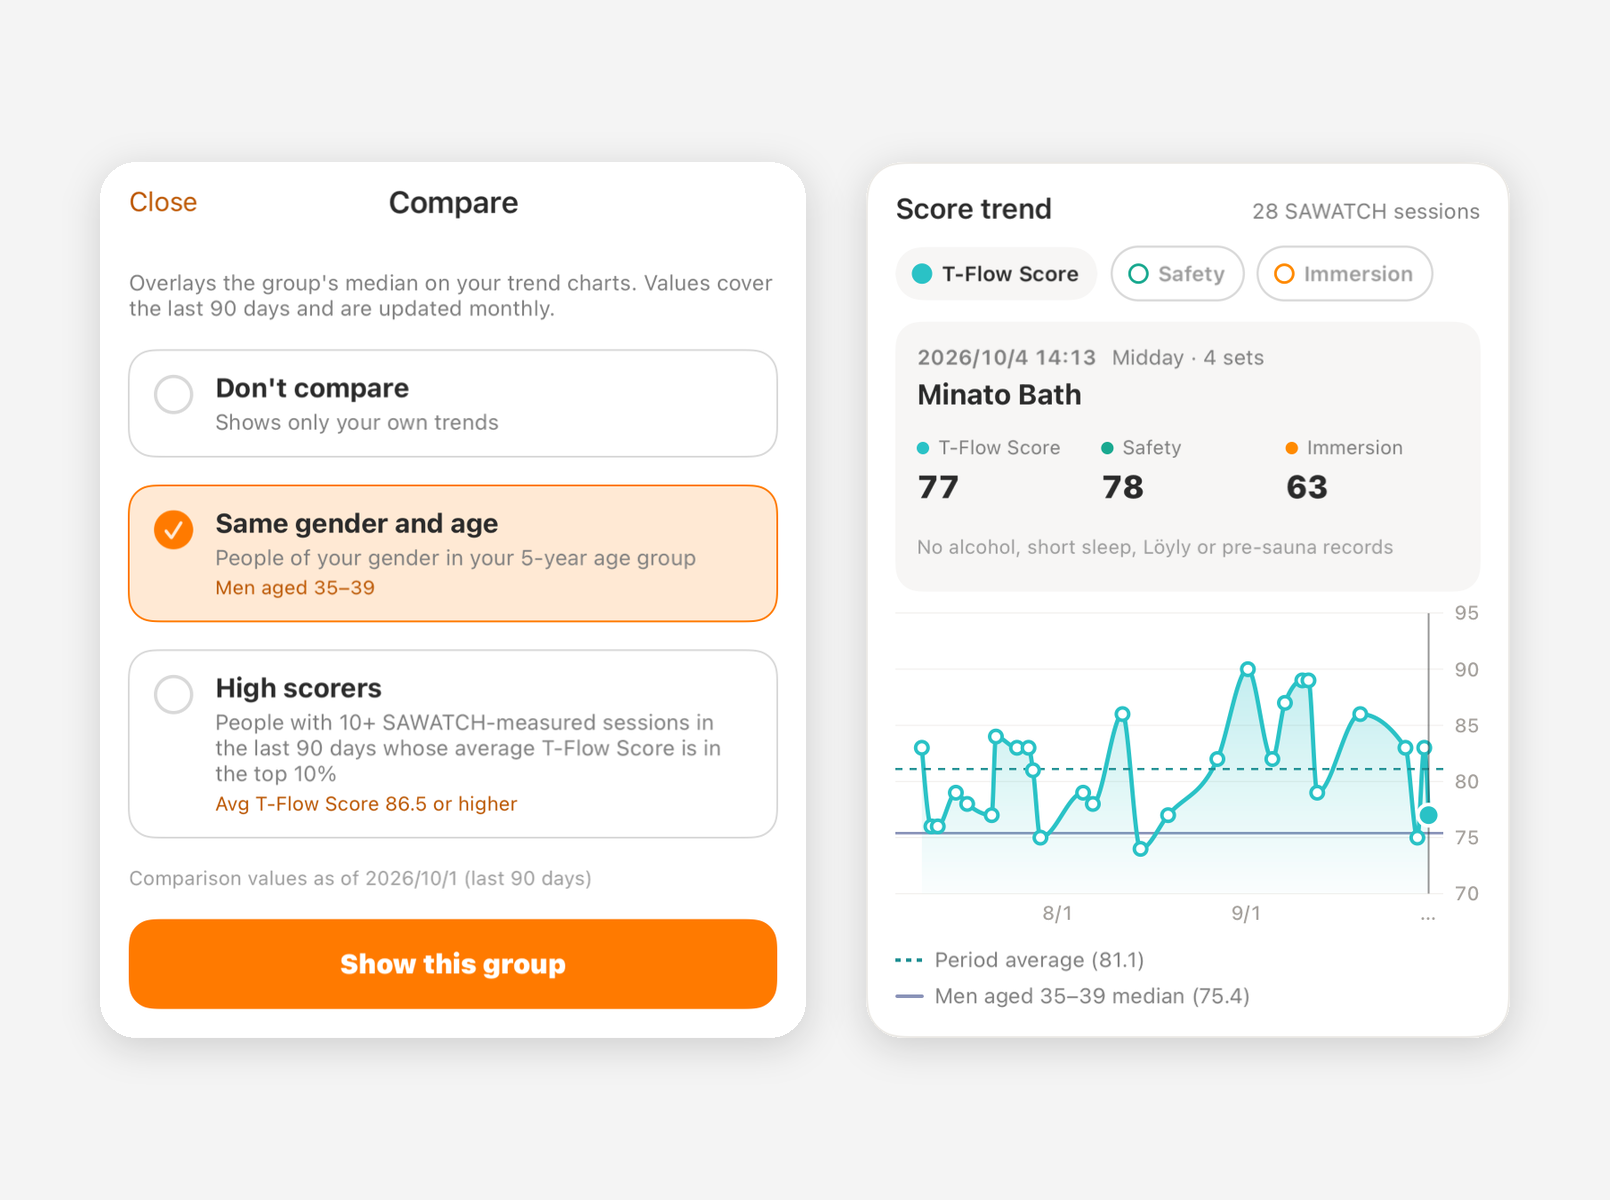
🔓 Feature exclusive to Premium Plan
When you select a target from "Compare" in the top right of the screen, the median of the comparison target will be overlaid on the trend graph as a line.
- Same gender/age group: People of the same gender in the same 5-year age group
- High scorers: People who measured with their sauna device 10 times or more in the last 90 days and whose average T-Flow Score is in the top 10%
Medians can be overlaid for T-Flow Score and Sleep Score trends, duration and heart rate by Scene, as well as sleep and wake times. In reflection memo trends, the proportion of answers from the comparison target is displayed side by side.
Comparison target values are aggregated once a month for the last 90 days.
💡 To select "Same gender/age group", you must register your gender and date of birth in your Profile. Groups with a small number of eligible people cannot be selected.
■ Required Records for Display
To display graphs and comparisons, the following records are required within the period.
- T-Flow Score trend: Totonoi Logs measured with a sauna device at least 2 times
- Sleep Score trend, sleep/wake times: Sleep Logs at least 2 times
- Steps / calories burned trend: Activity level records at least 2 days
- What worked, comparisons by category, AI recommendations: 3 times or more
- Memo trends: From items with answers 3 or more times
Totonoi Logs recorded manually without using a sauna device are not included in the T-Flow Score aggregation.
💡 Leaving reflection memos in Totonoi Logs or sleep memos in Sleep Logs increases the conditions for comparison and enriches your Totonoi Karte.
■ Differences by sauna device model
If you are using SHOWDOWN 1, the following items are not measured or calculated, so they will not be displayed.
- Recovery
- Steps and calories burned
- Sleep Need and Sleep Debt
- REM sleep (included in light sleep)
■ Differences Between Basic Plan and Premium Plan
With the Basic Plan, you can view the dashboard and each Karte for the past 30, 60, and 90 days.
🔓 With the Premium Plan, you can also use the following features:
- Aggregations for 6 months, 1 year, all-time, or custom specified periods
- Compare with everyone
- Per-Set conditions for sauna "effects"
- Sauna Karte by "number of Sets" and "time of day"
- Sleep Need and Sleep Debt in the Sleep Karte