[Update] New metrics and the Vital Graph Viewer have been added to the Vital Graph (formerly Heart Rate Graph)!
Apr 20, 2026

Thank you for always using "Sanokuni"!
This is an update notice.
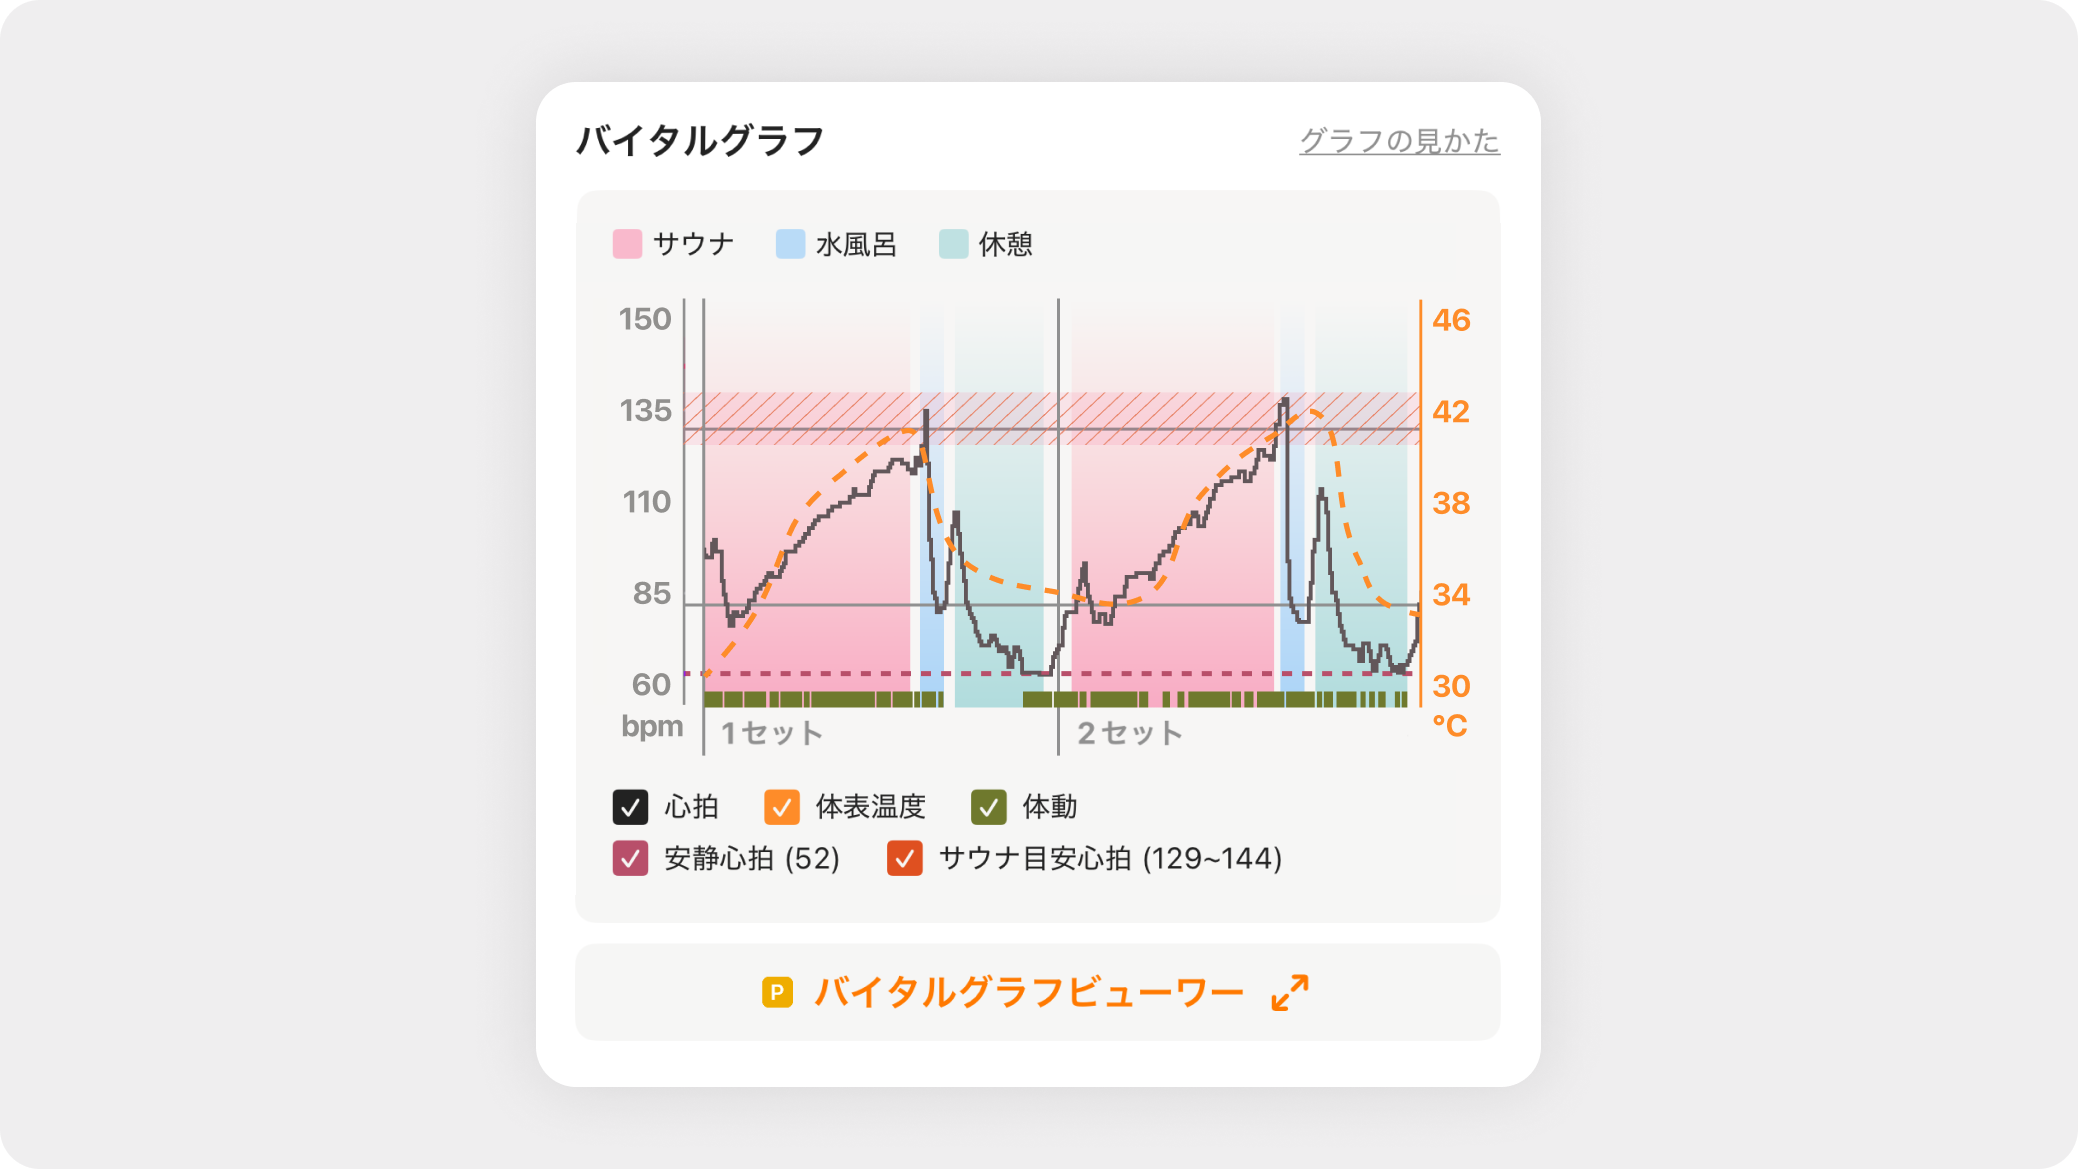
1. Skin temperature and body movement can now be viewed on the heart rate graph
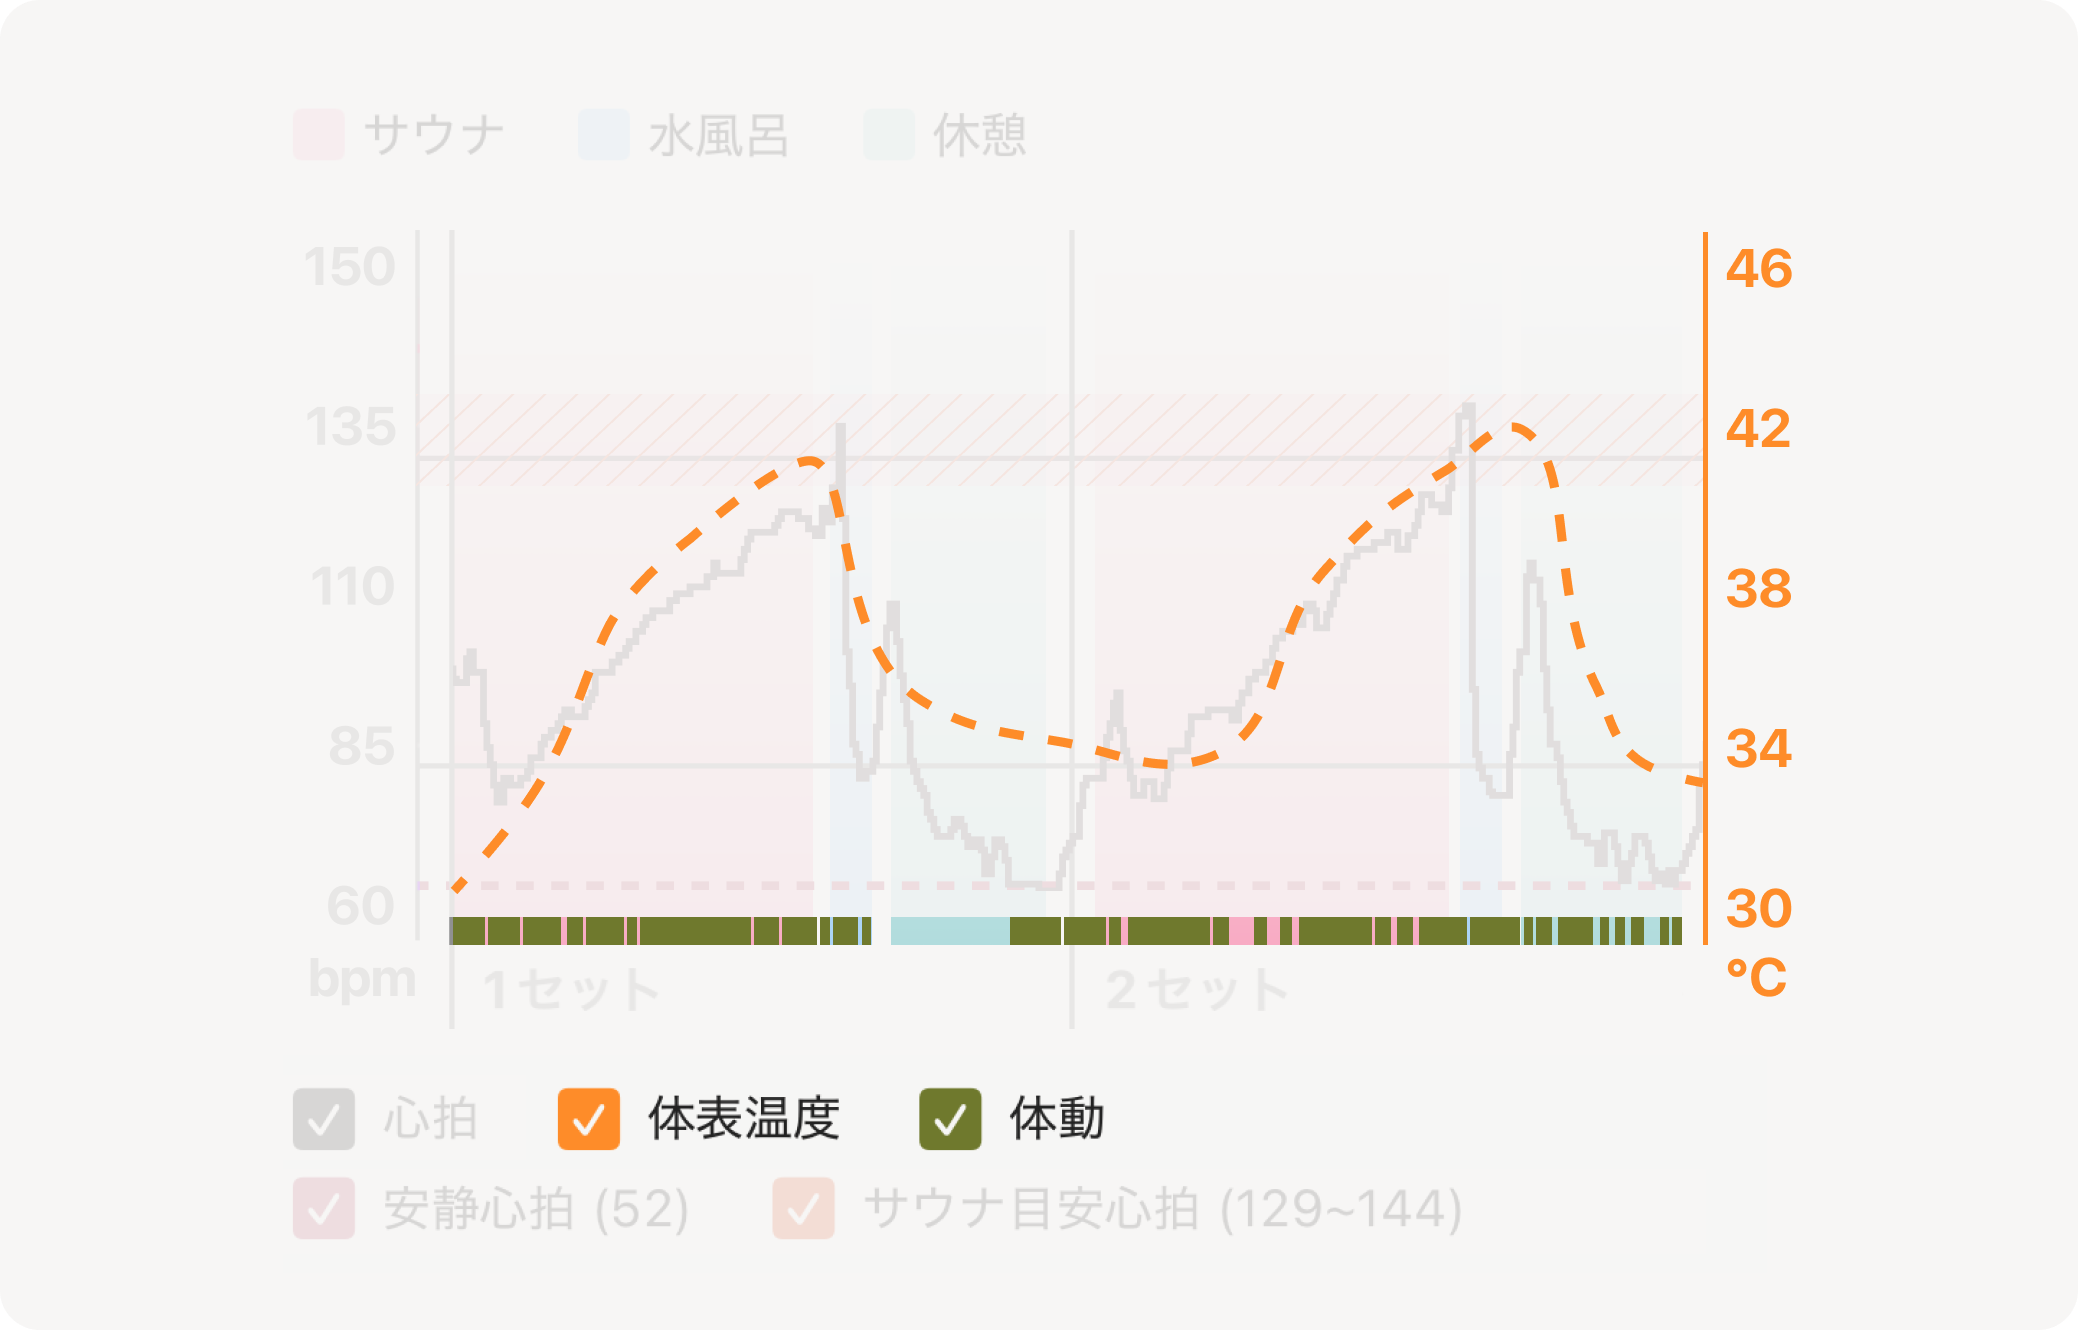
In addition to the graph that previously only displayed heart rate, skin temperature and body movement have been newly added!
- Skin temperature: Shows how much the surface of your body is warmed up. It serves as a guide for how your body reacts in each of the sauna, cold bath, and rest periods.
- Body movement: Allows you to check your state of calmness and changes in load from the amount of body movement.
You can now look back on the effects on your body from more diverse angles, not just changes in your heart rate.
Along with this, the graph name has been changed to "Vital Graph".
2. You can customize the metrics to display
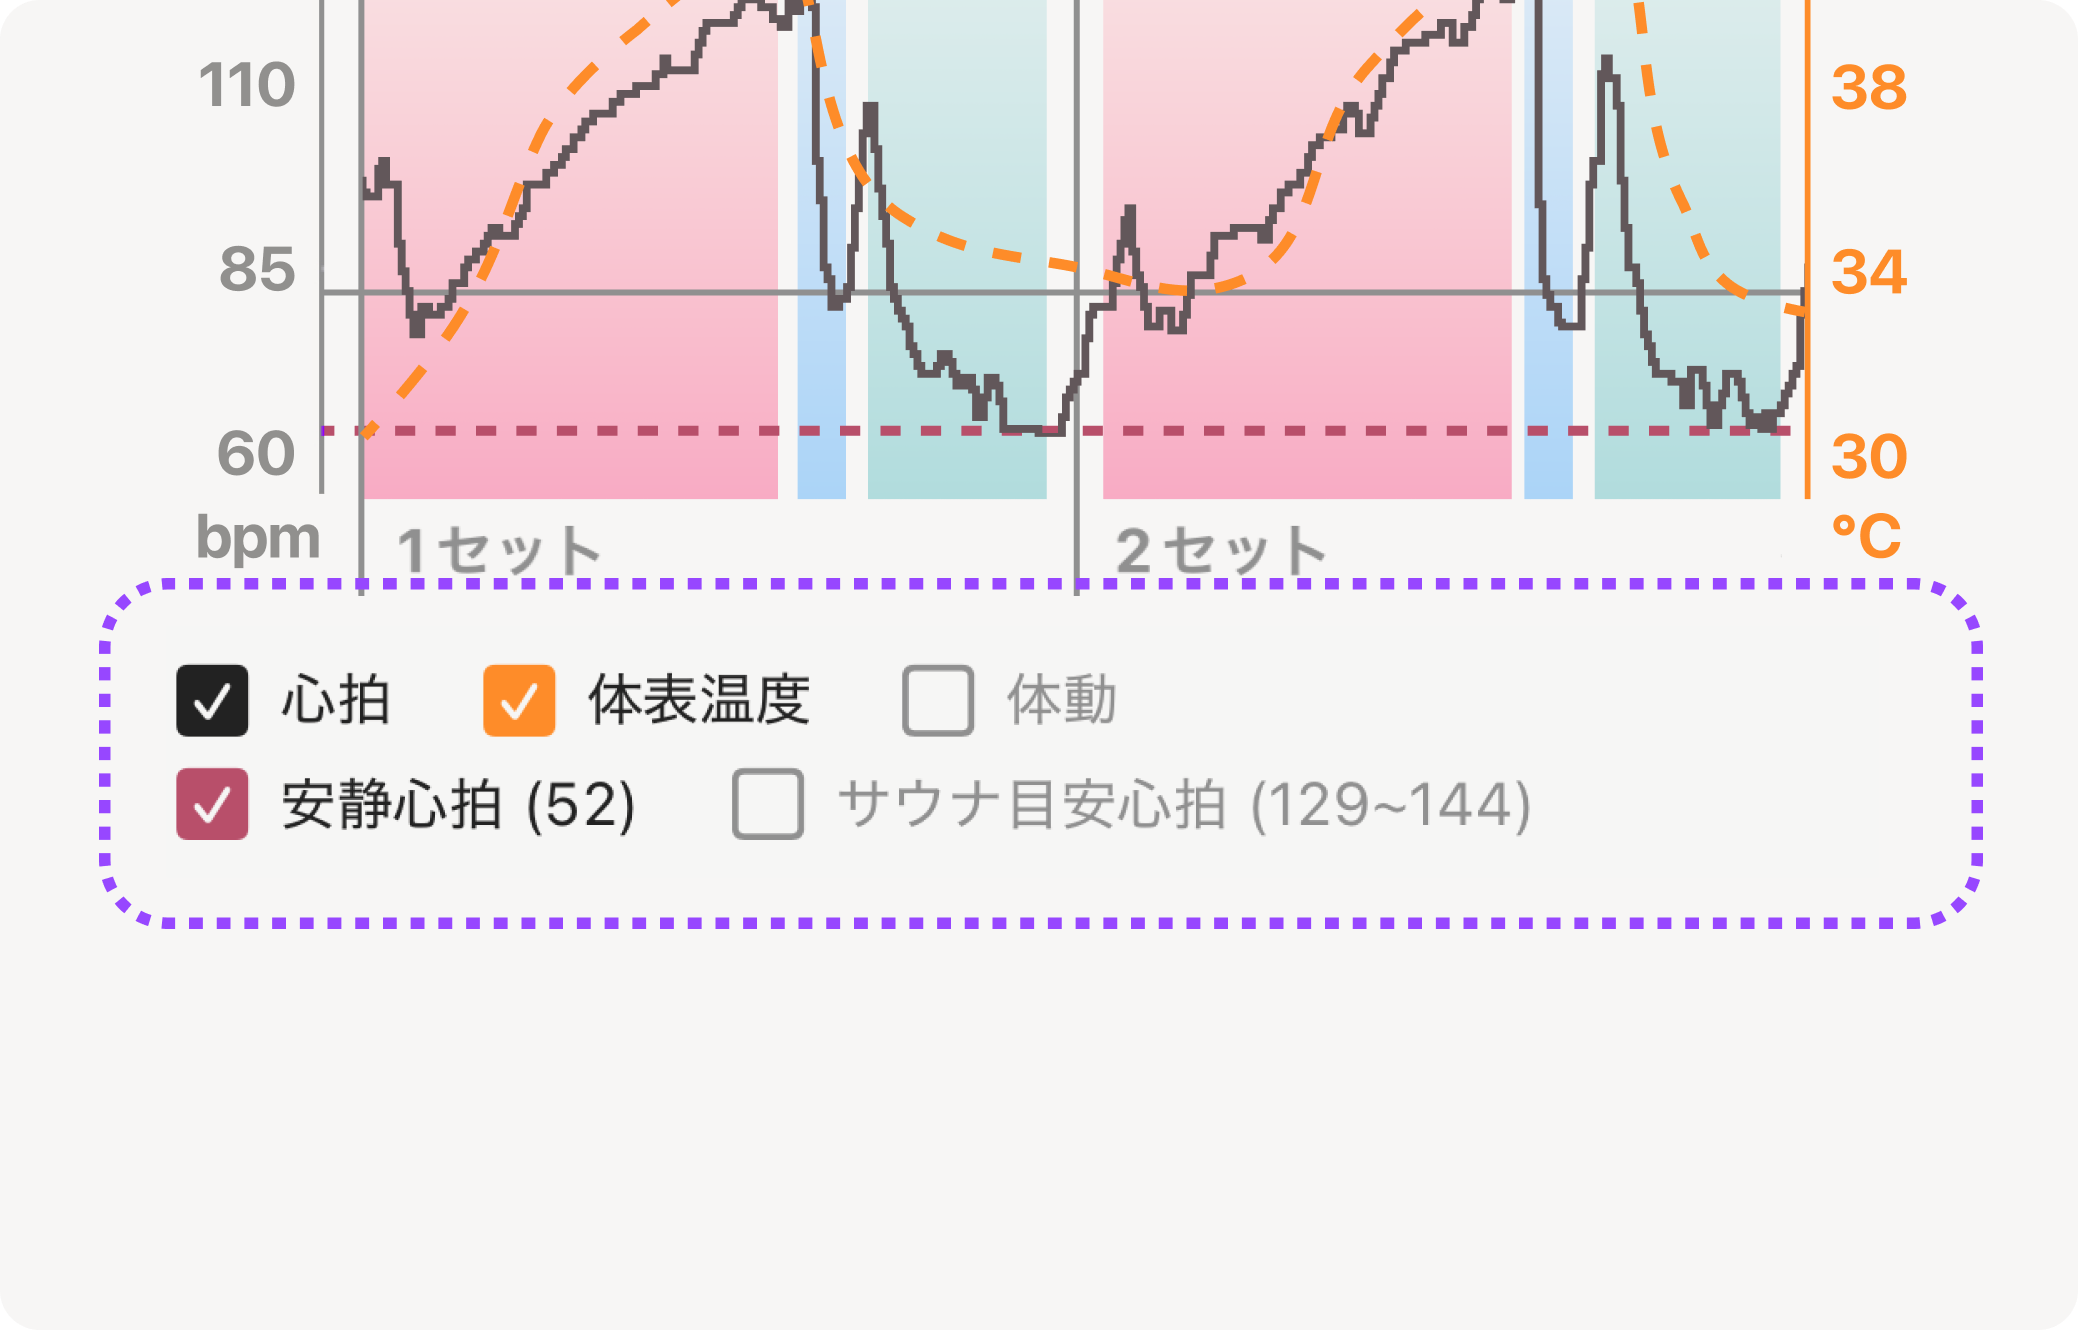
Using the checkmarks on the graph, you can toggle the display of each of the following metrics.
- Heart rate
- Skin temperature
- Body movement
- Resting heart rate
- Target sauna heart rate
Since you can view the graph by focusing only on the information you want to see, please use it according to your own goals!
3. [Premium Plan Only] Vital Graph Viewer has been added
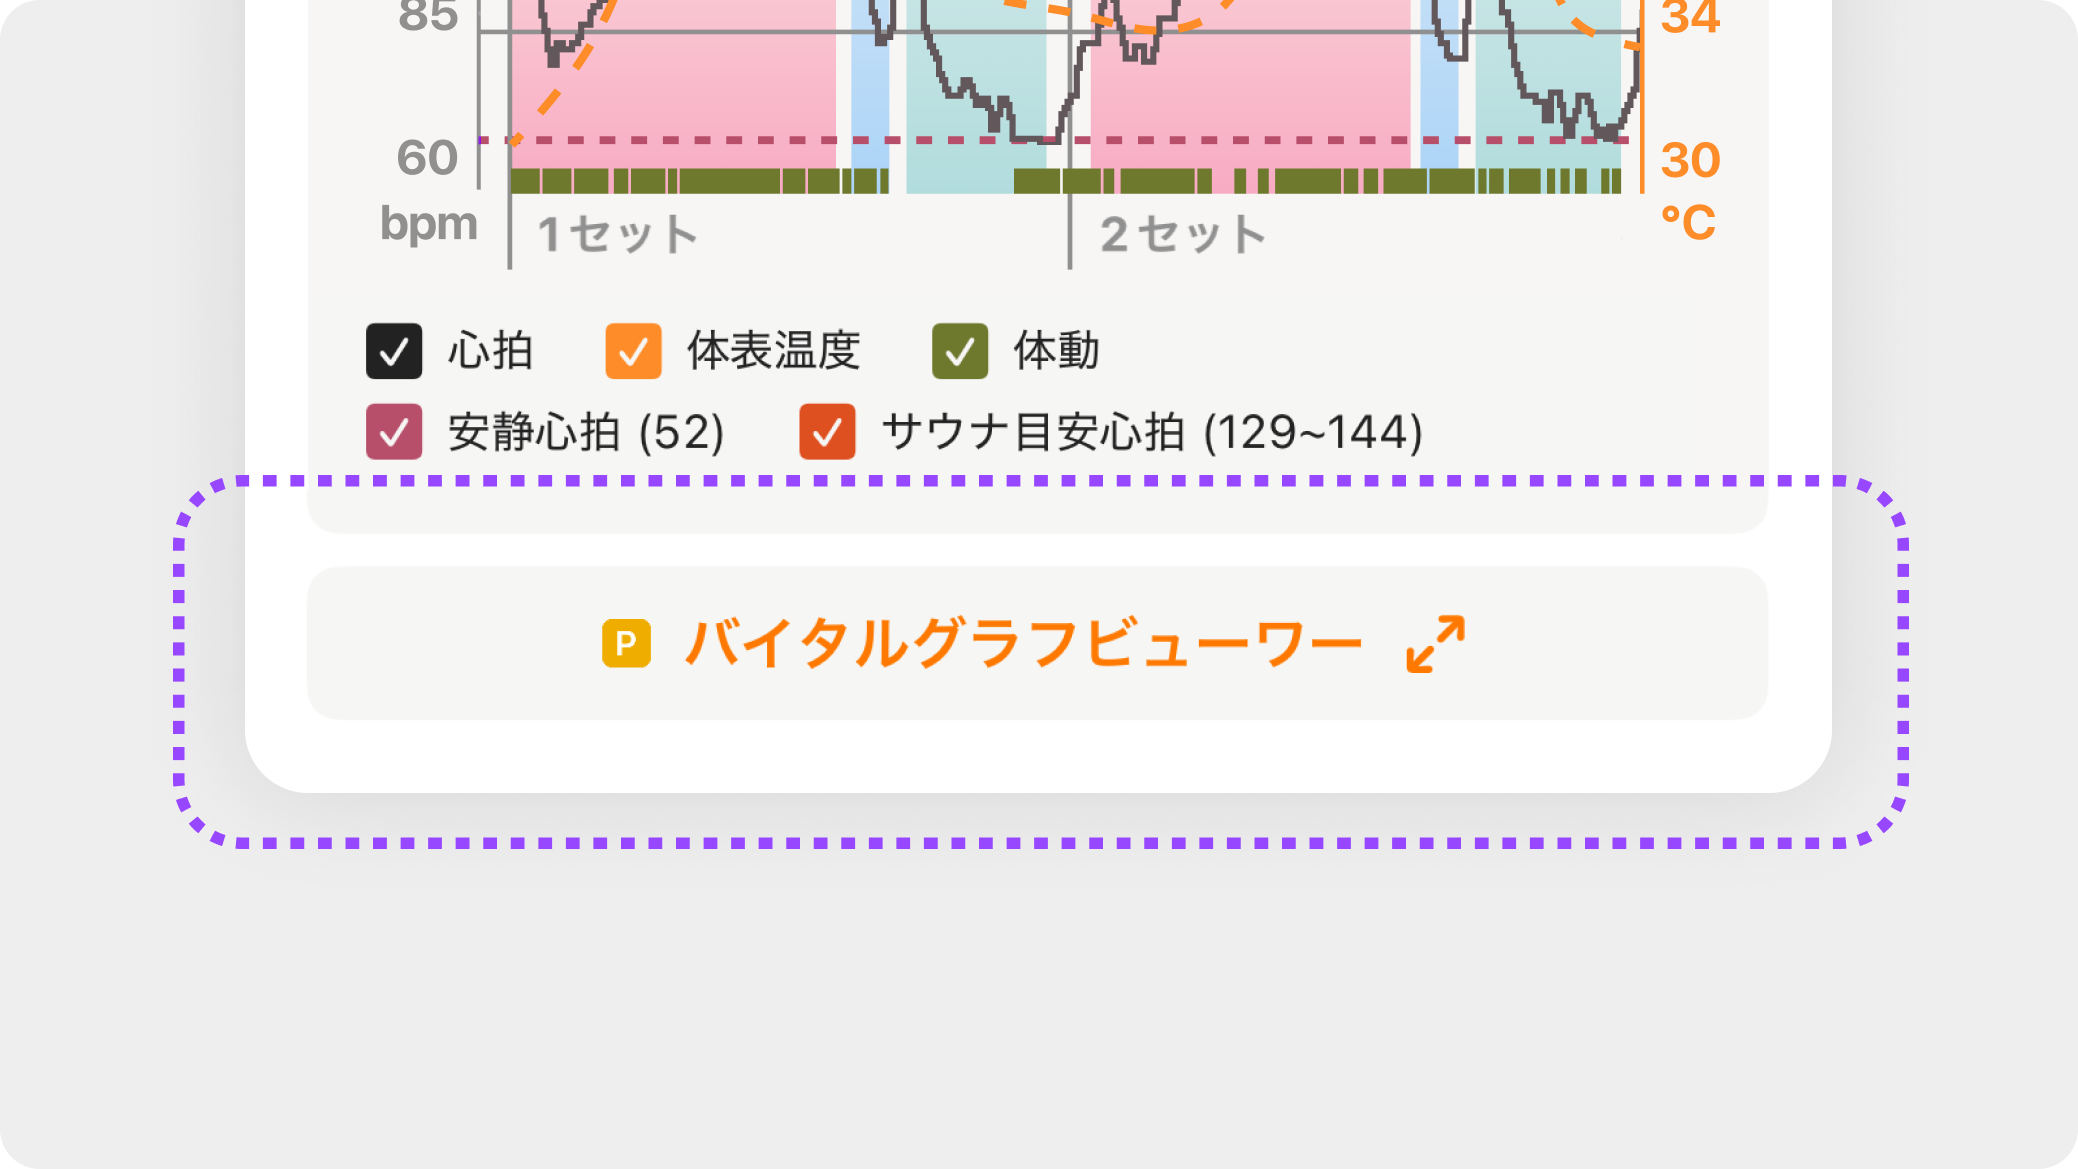
For Premium Plan users, the Vital Graph Viewer has been added, allowing you to check vital data such as heart rate, body movement, and skin temperature in more detail.
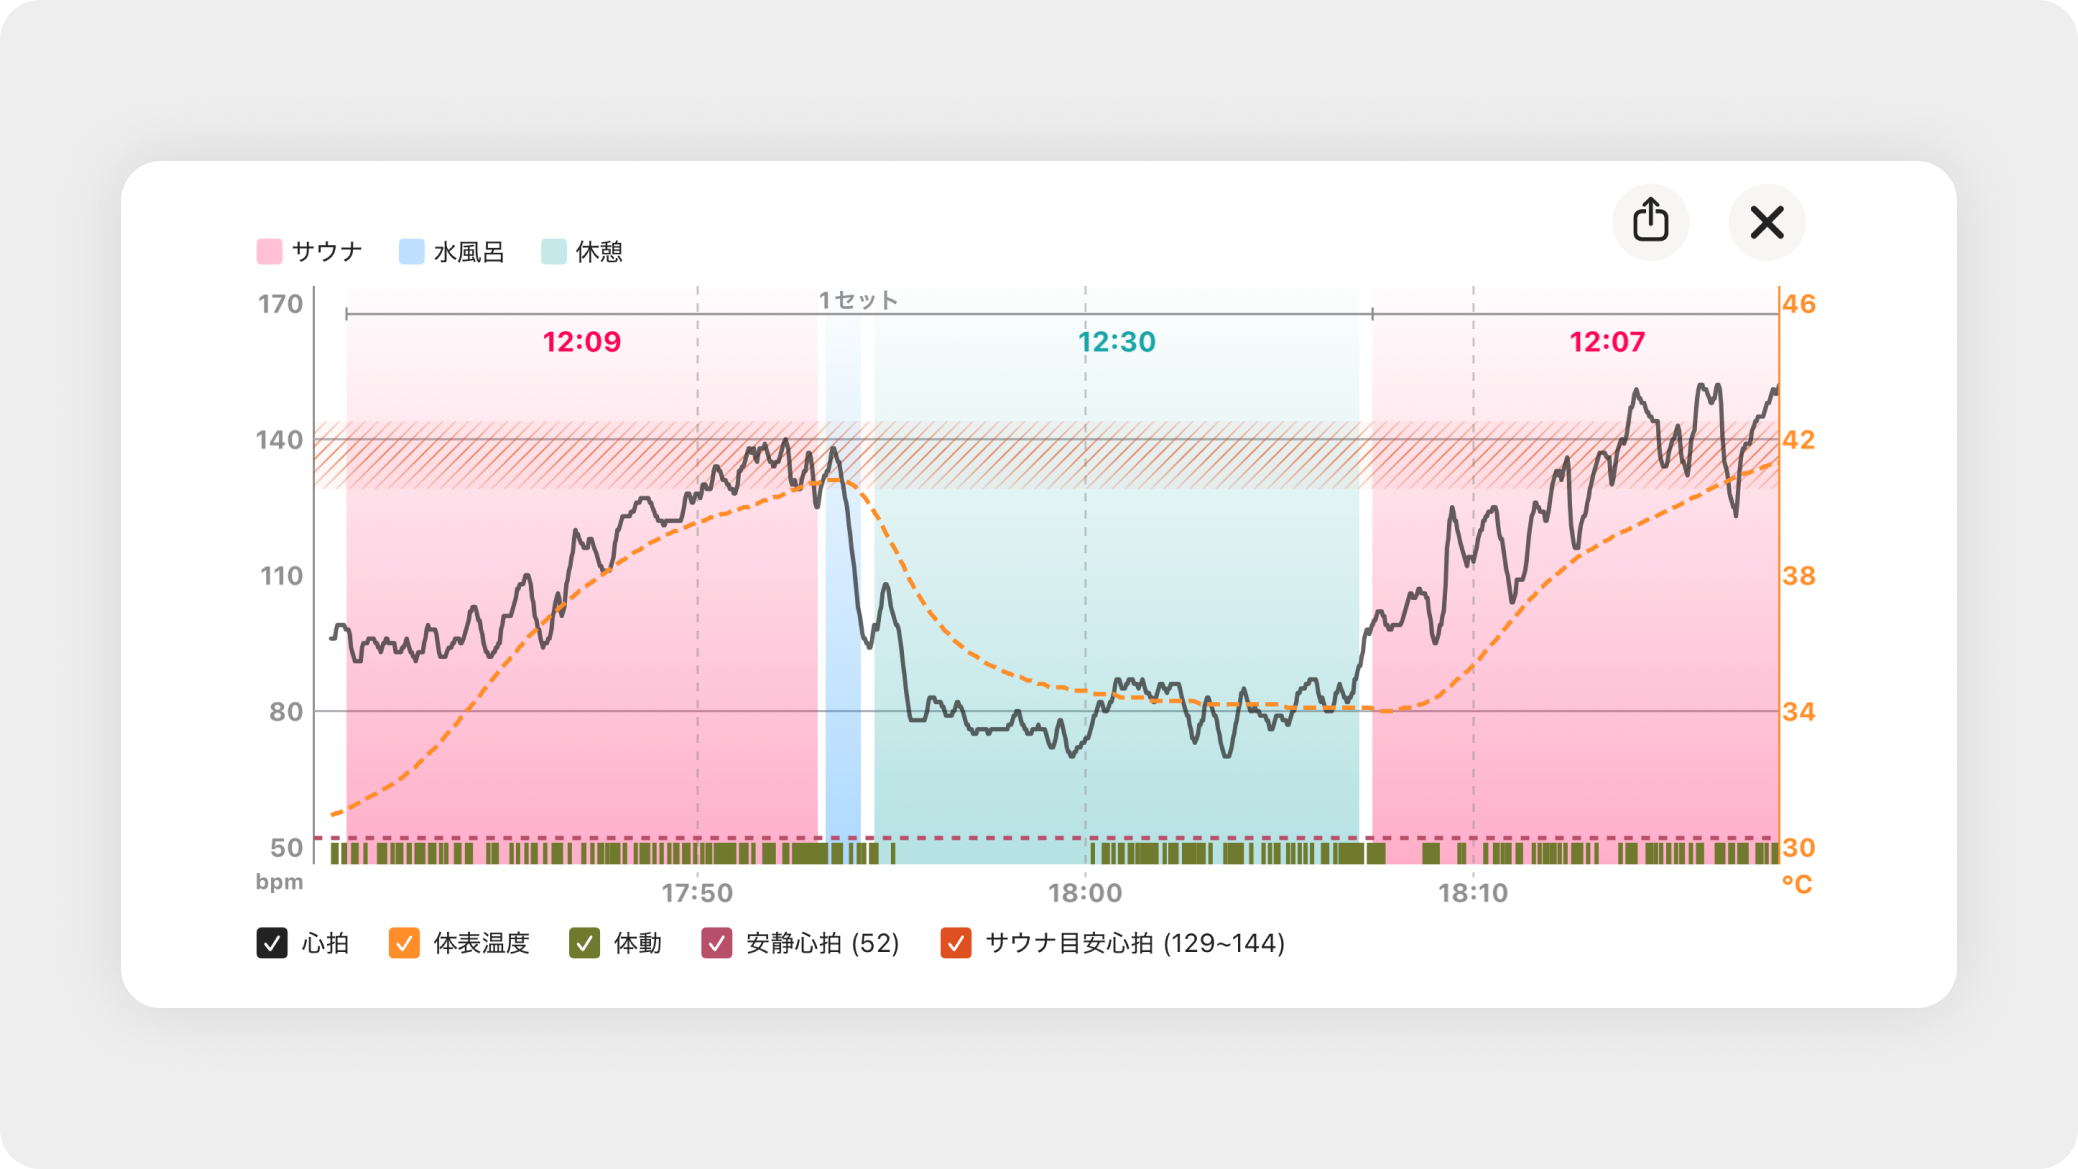
sauna, cold plunge, and rest—you can now check data changes across the entire session on a large screen, which helps you analyze your totonoi in greater depth.
That is all from Sanokuni regarding the Vital Graph Update.
Thank you for your continued support of Sanokuni!