How to Read the ANS Performance Graph
May 14, 2025
This graph shows the activity level of your autonomic nervous system during the rest period of each Set. It helps you see which Set made it easier to totonoi and how it changed, allowing you to understand the tendencies of the number of Sets and rhythm that suit you.
For details, please refer to What is ANS Performance.
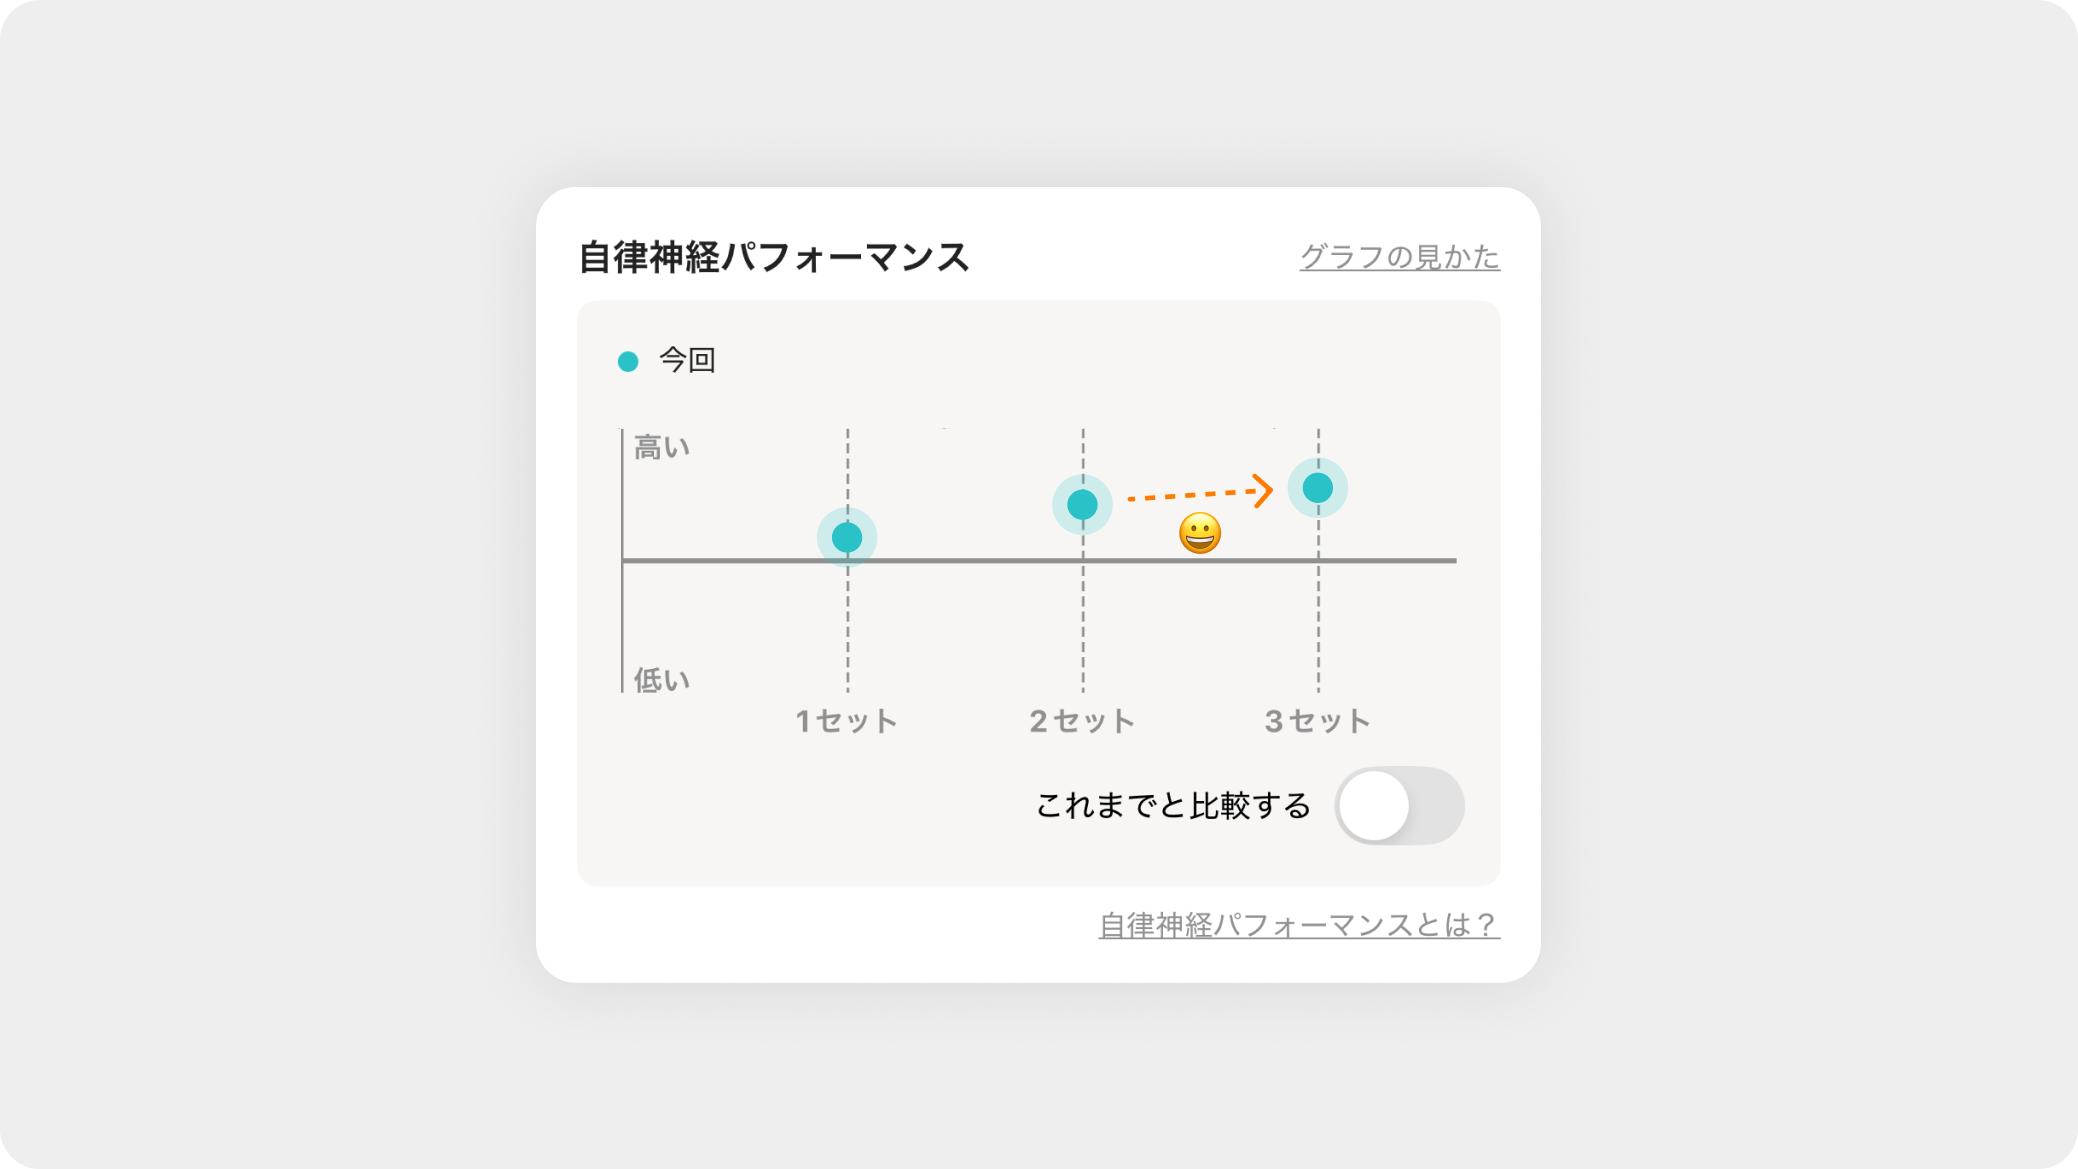
1. How to Read the Graph
1.1 Vertical and Horizontal Axes
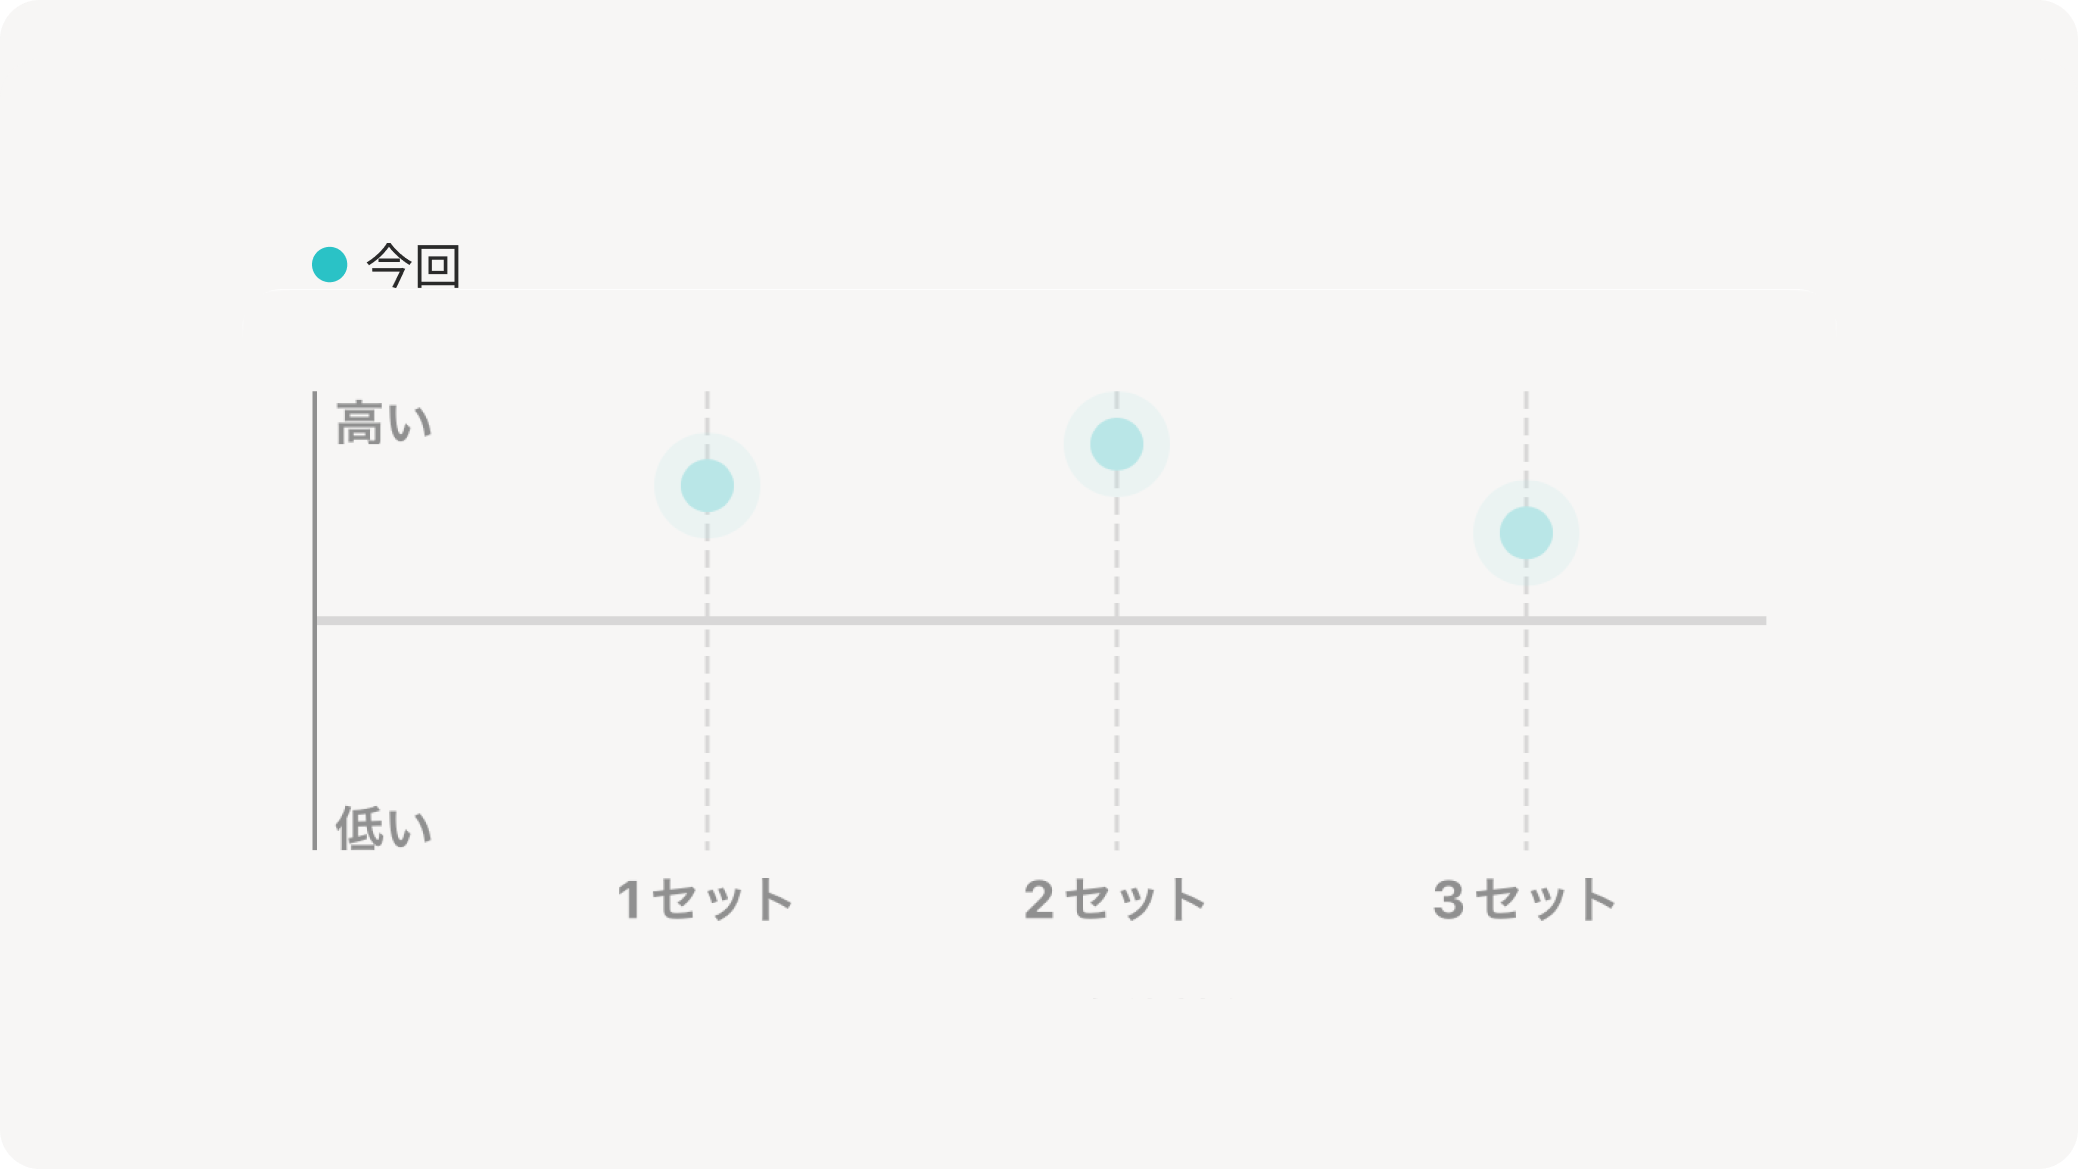
Horizontal axis: Number of sauna Sets
Vertical axis: Level of ANS Performance
1.2 ANS Performance (Today's Sauna Session)
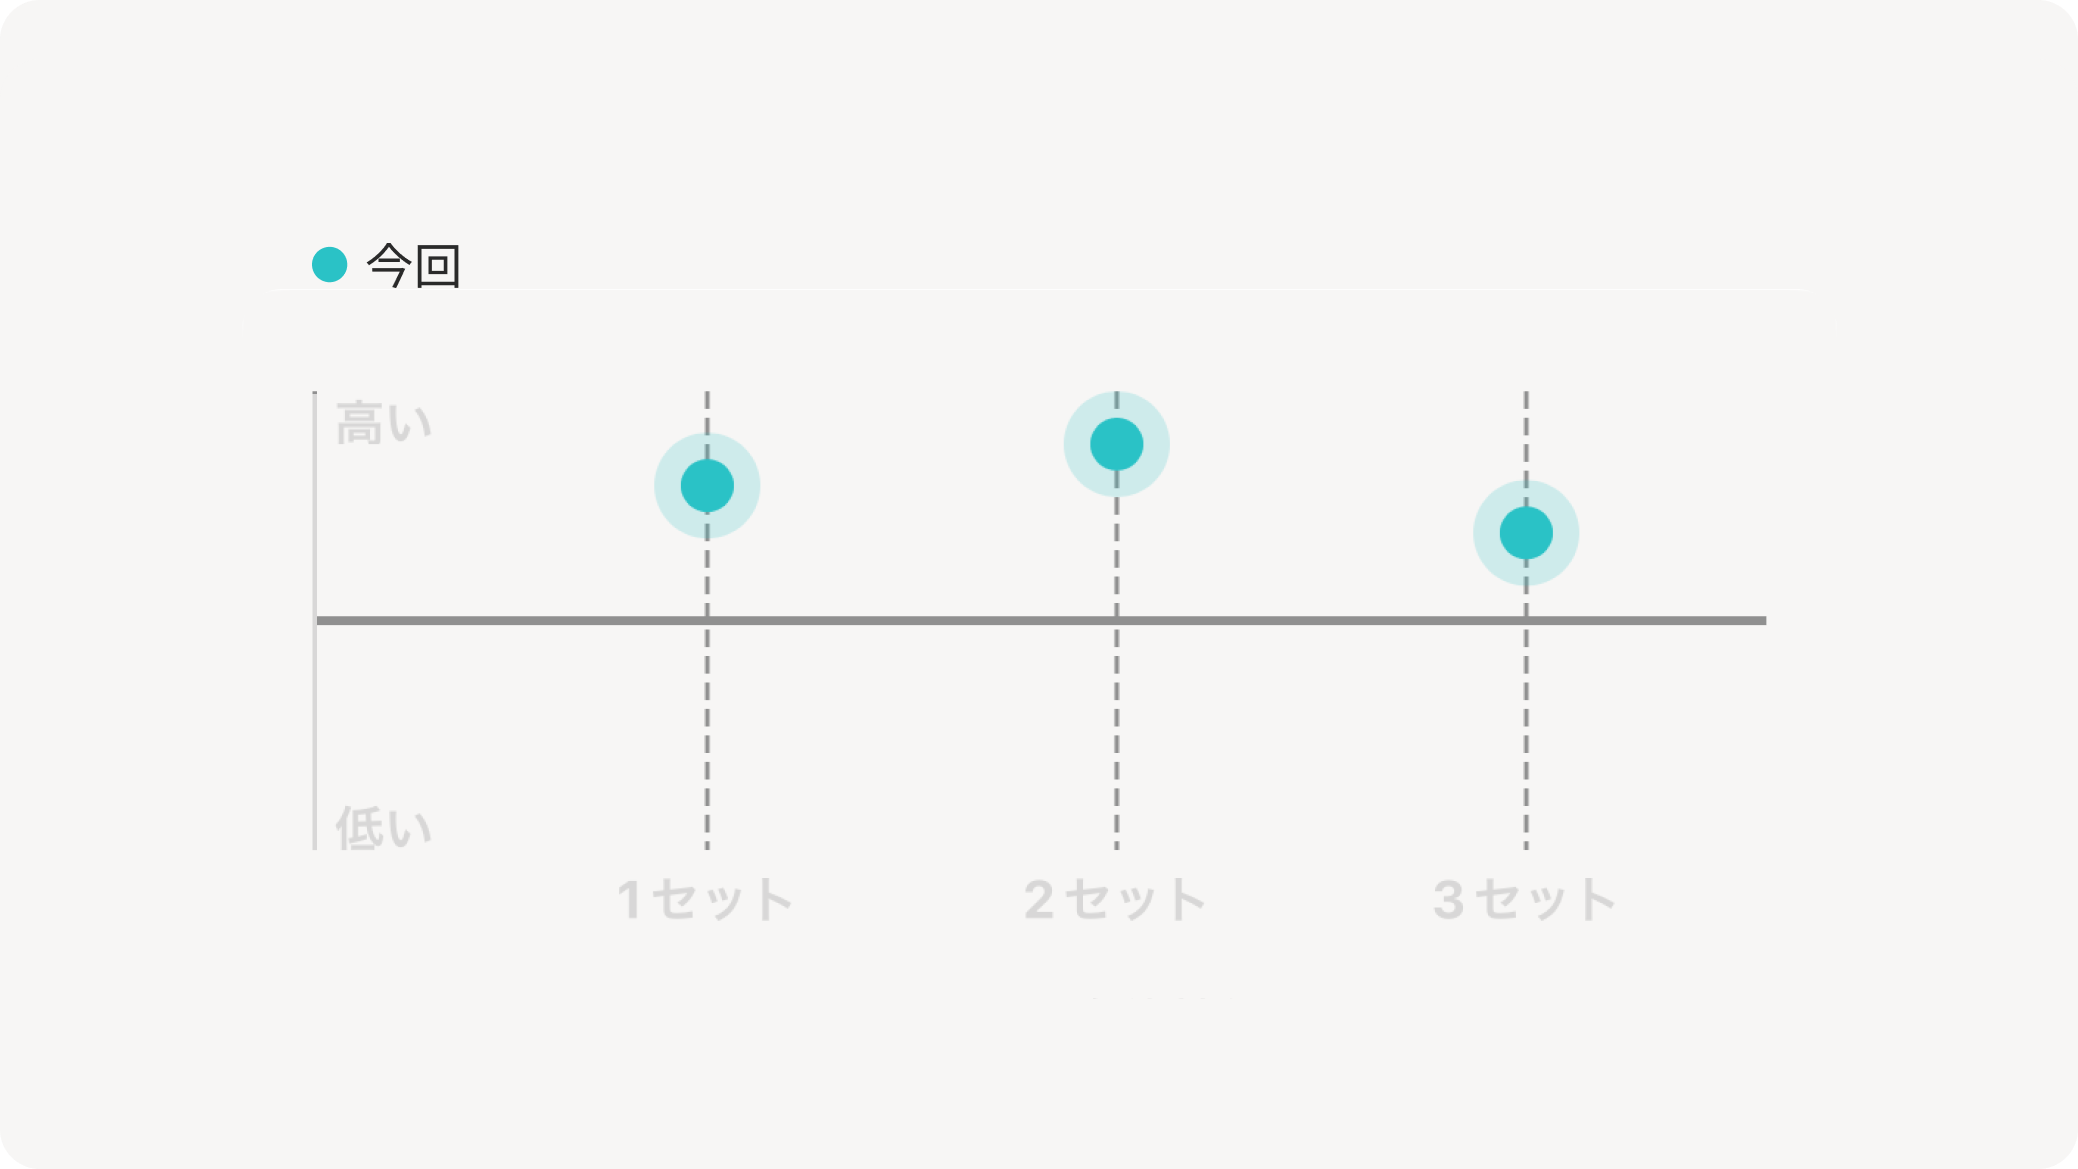
The state immediately after the rest period of each Set is represented by the height of the dot.
- Sets with high dots
Highly likely that the autonomic nervous system functioned well and the mind and body achieved totonoi. - Sets with low dots
Possibility that recovery did not go well during rest, or there were too many Sets.
1.3 ANS Performance (Historical Average)
*This feature was released on 2025/10/07.
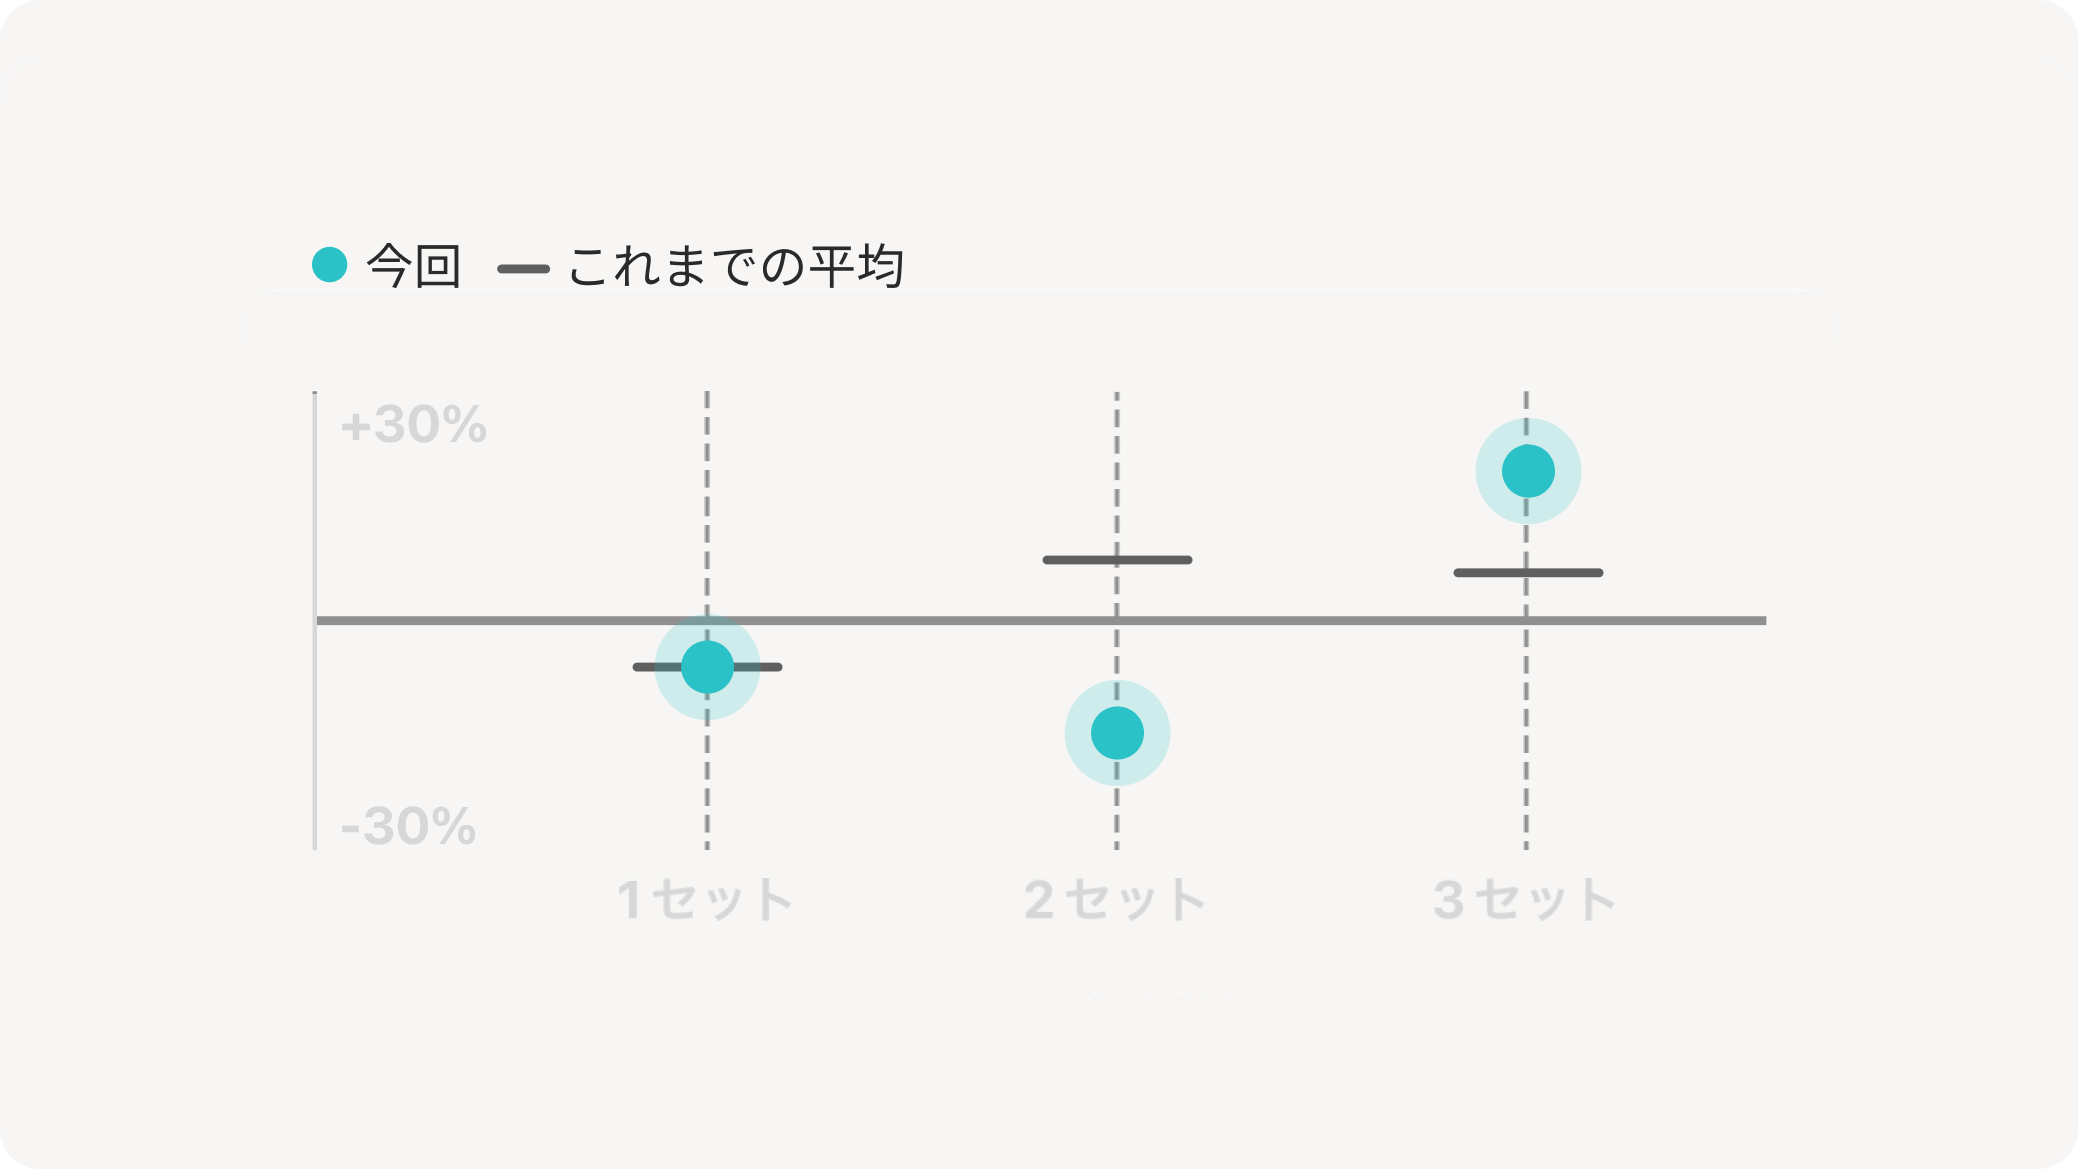
The average of past ANS Performance is represented by the height of the horizontal line.
- Sets with high lines
On average, the autonomic nervous system is functioning well. - Sets with low lines
On average, recovery during rest is not going well. Autonomic nervous system activity is weak.
*The "Historical Average" is a feature exclusive to the Premium Plan.
2. How to Utilize ANS Performance
2.1 During which Set is your ANS Performance declining?
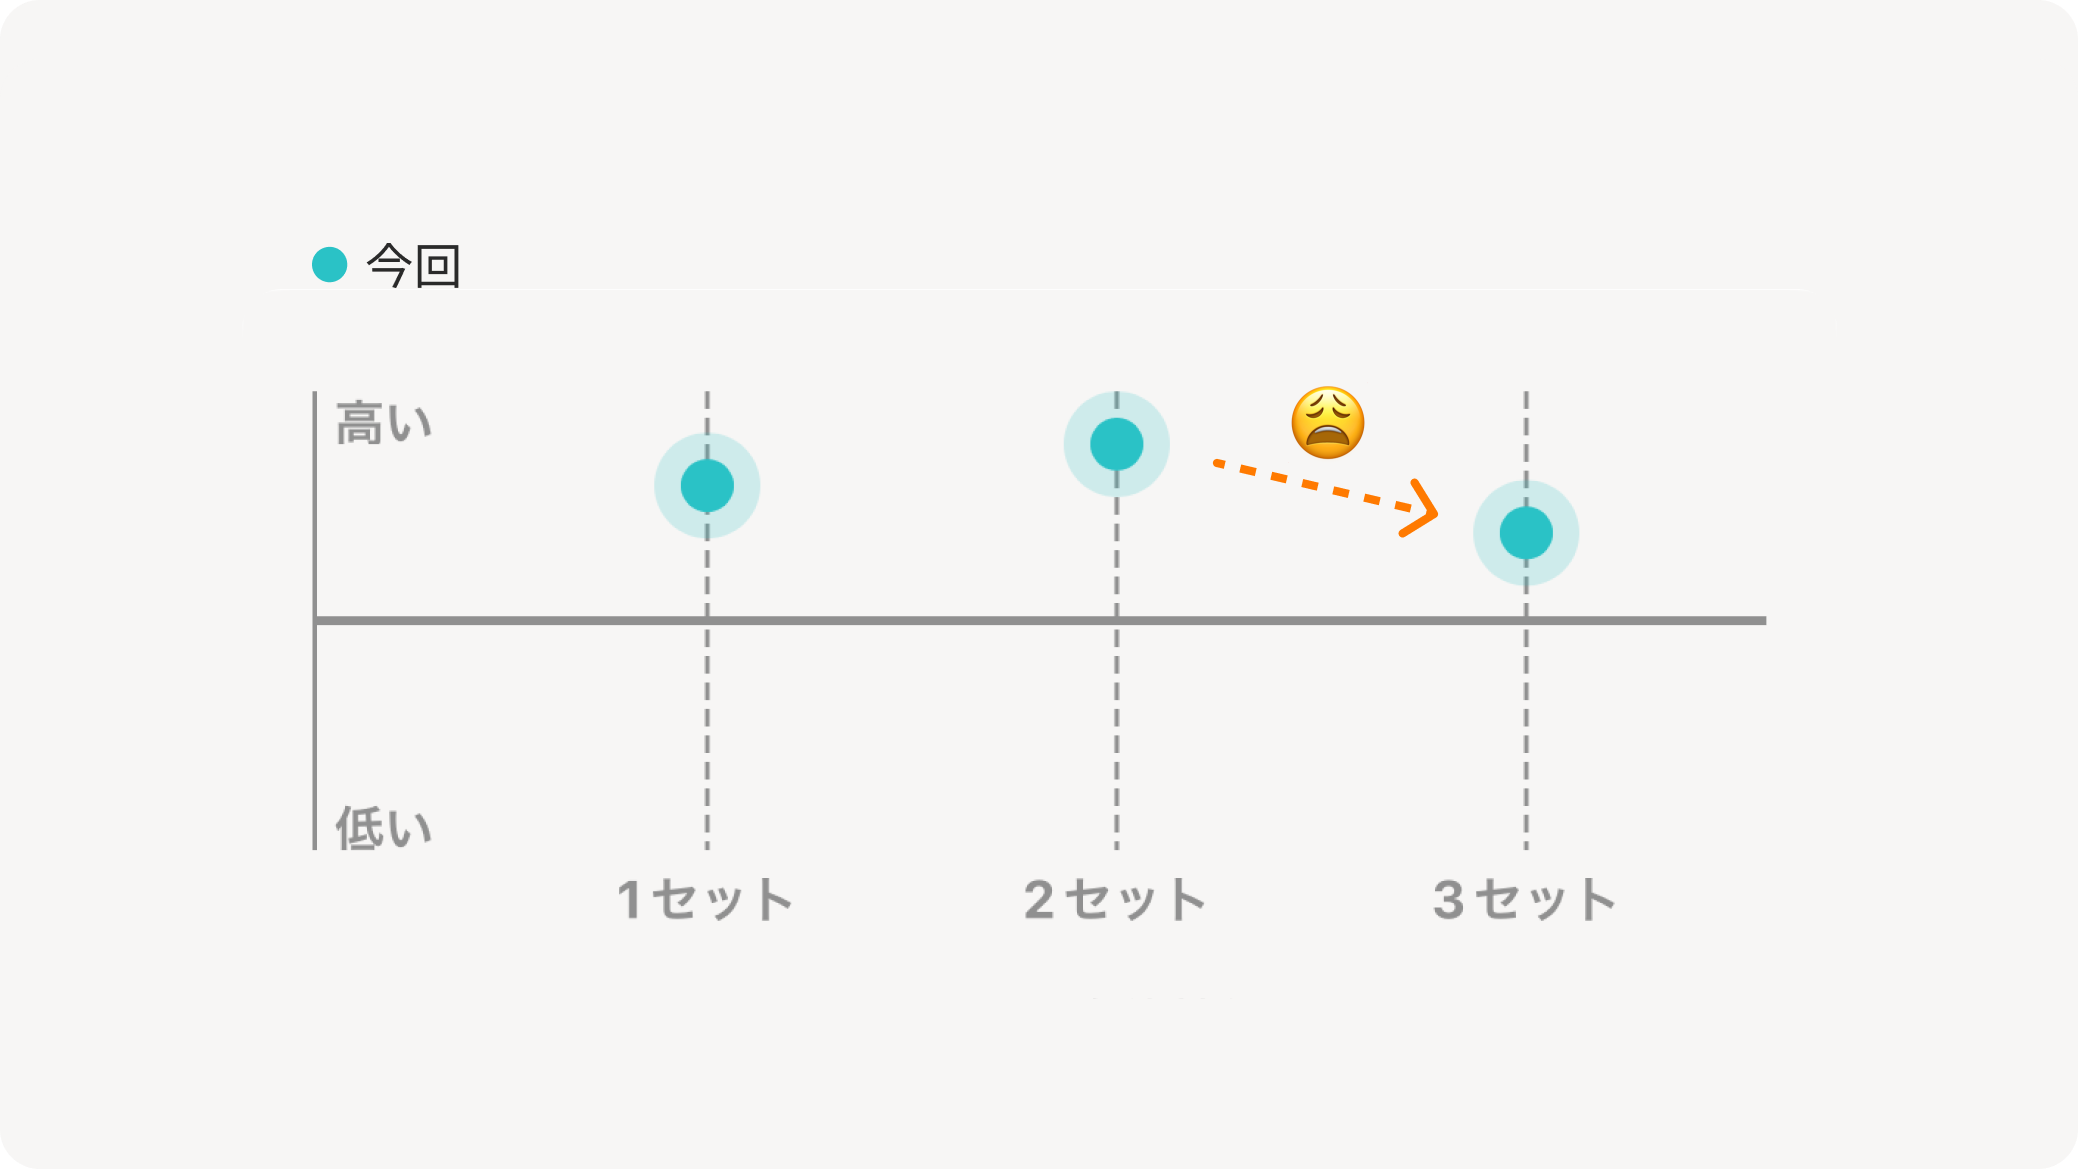
If the numbers are high during the 1st and 2nd Sets, but decrease in the 3rd Set, your autonomic nervous system may be fatigued.
If the autonomic nervous system does not function properly, dizziness and lightheadedness are more likely to occur, and the risk of heatstroke or falling also increases.
2.2 Wanting to maintain ANS Performance until the final Set
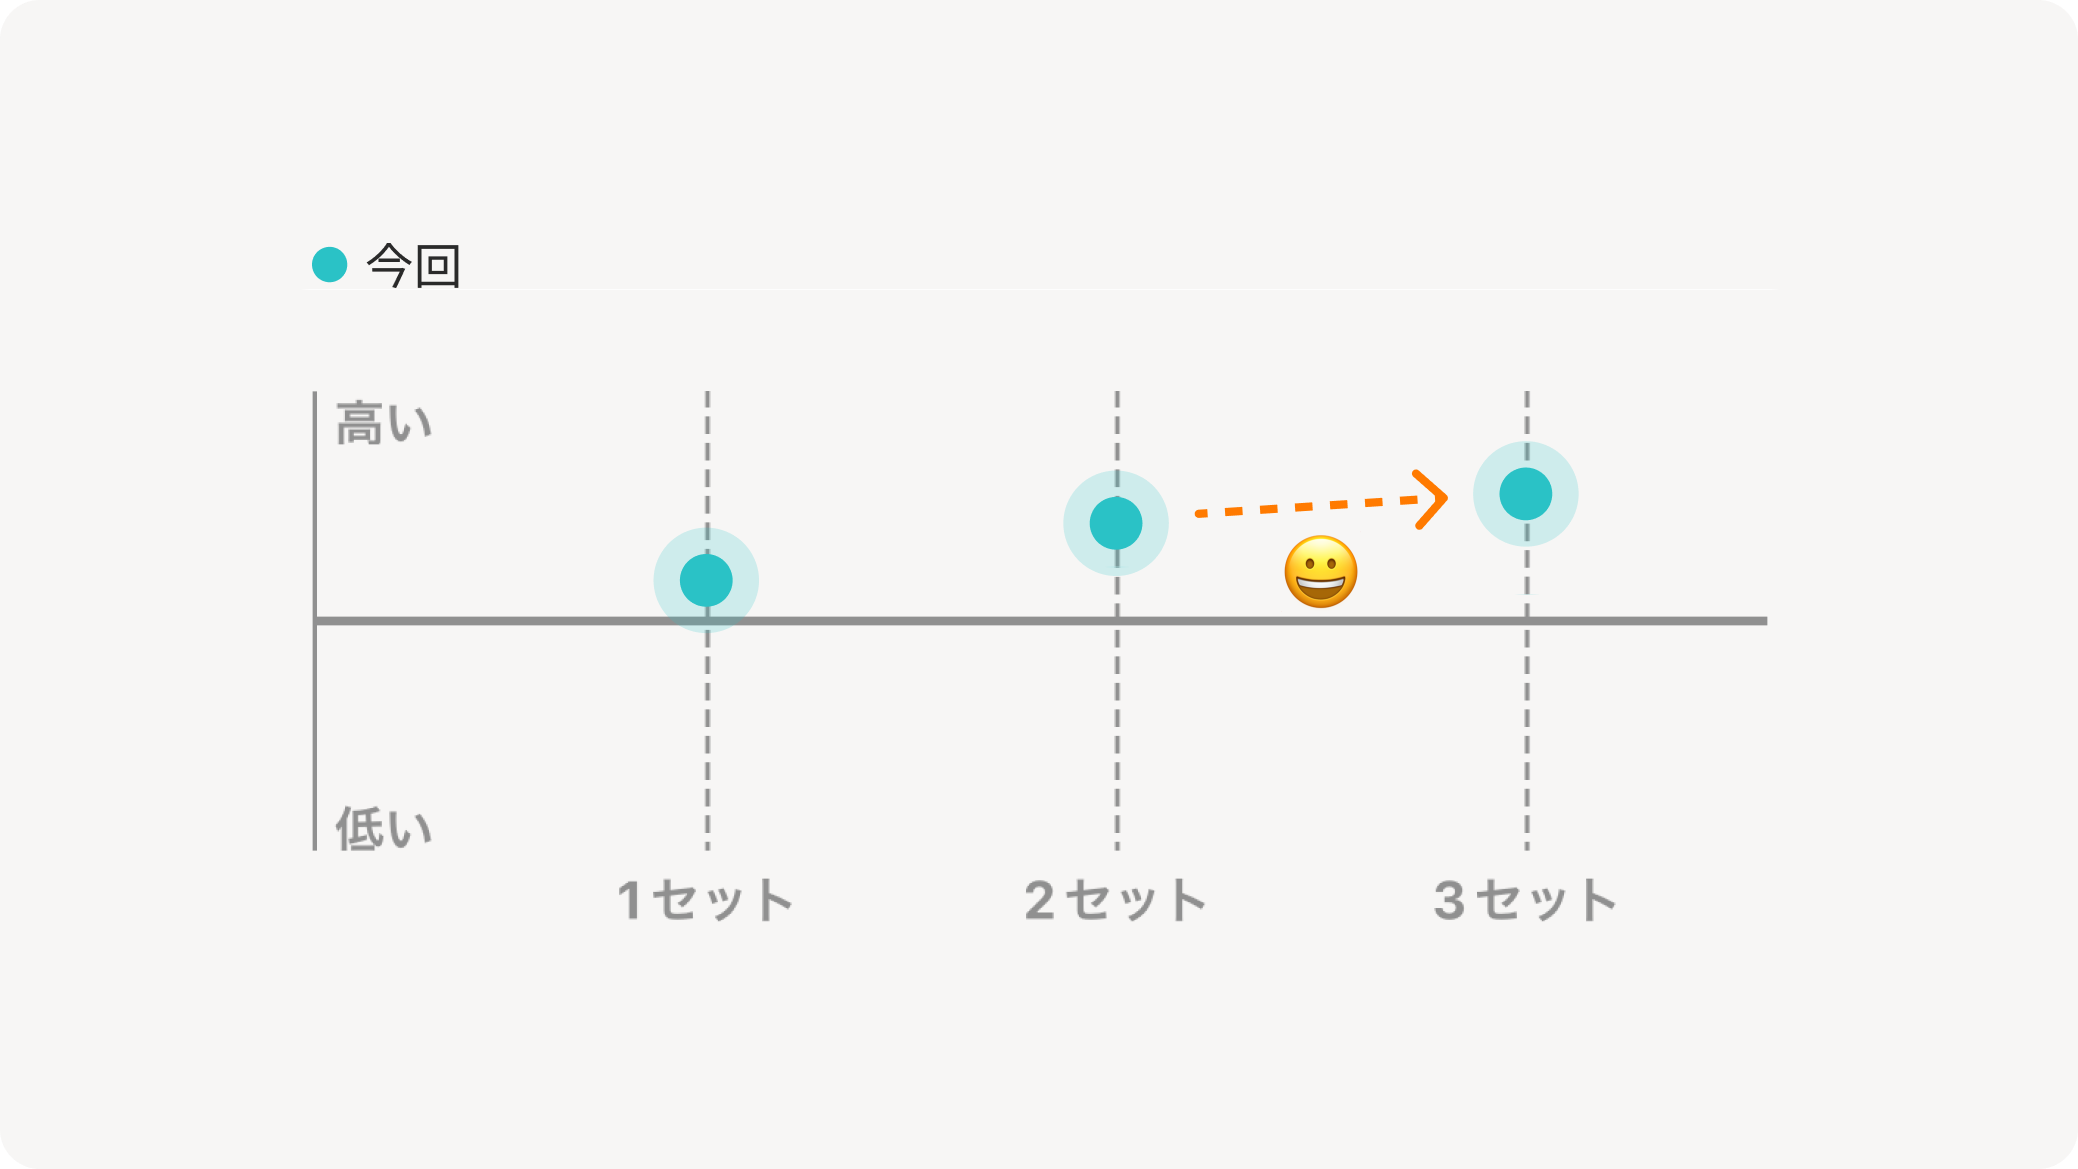
The number of sauna Sets varies from person to person, such as "I want to enjoy 4 Sets since I'm here" or "I only have time for 2 Sets today." The important thing is to maintain your ANS Performance until your ideal Set.
To achieve this, it is important to be creative with your sitting position in the sauna room, target heart rate, the temperature and duration of the cold bath, and how you take breaks. Try to find a way to maintain your ANS Performance while making adjustments that suit you.
2.3 How much better was your ANS Performance this time compared to your past self?
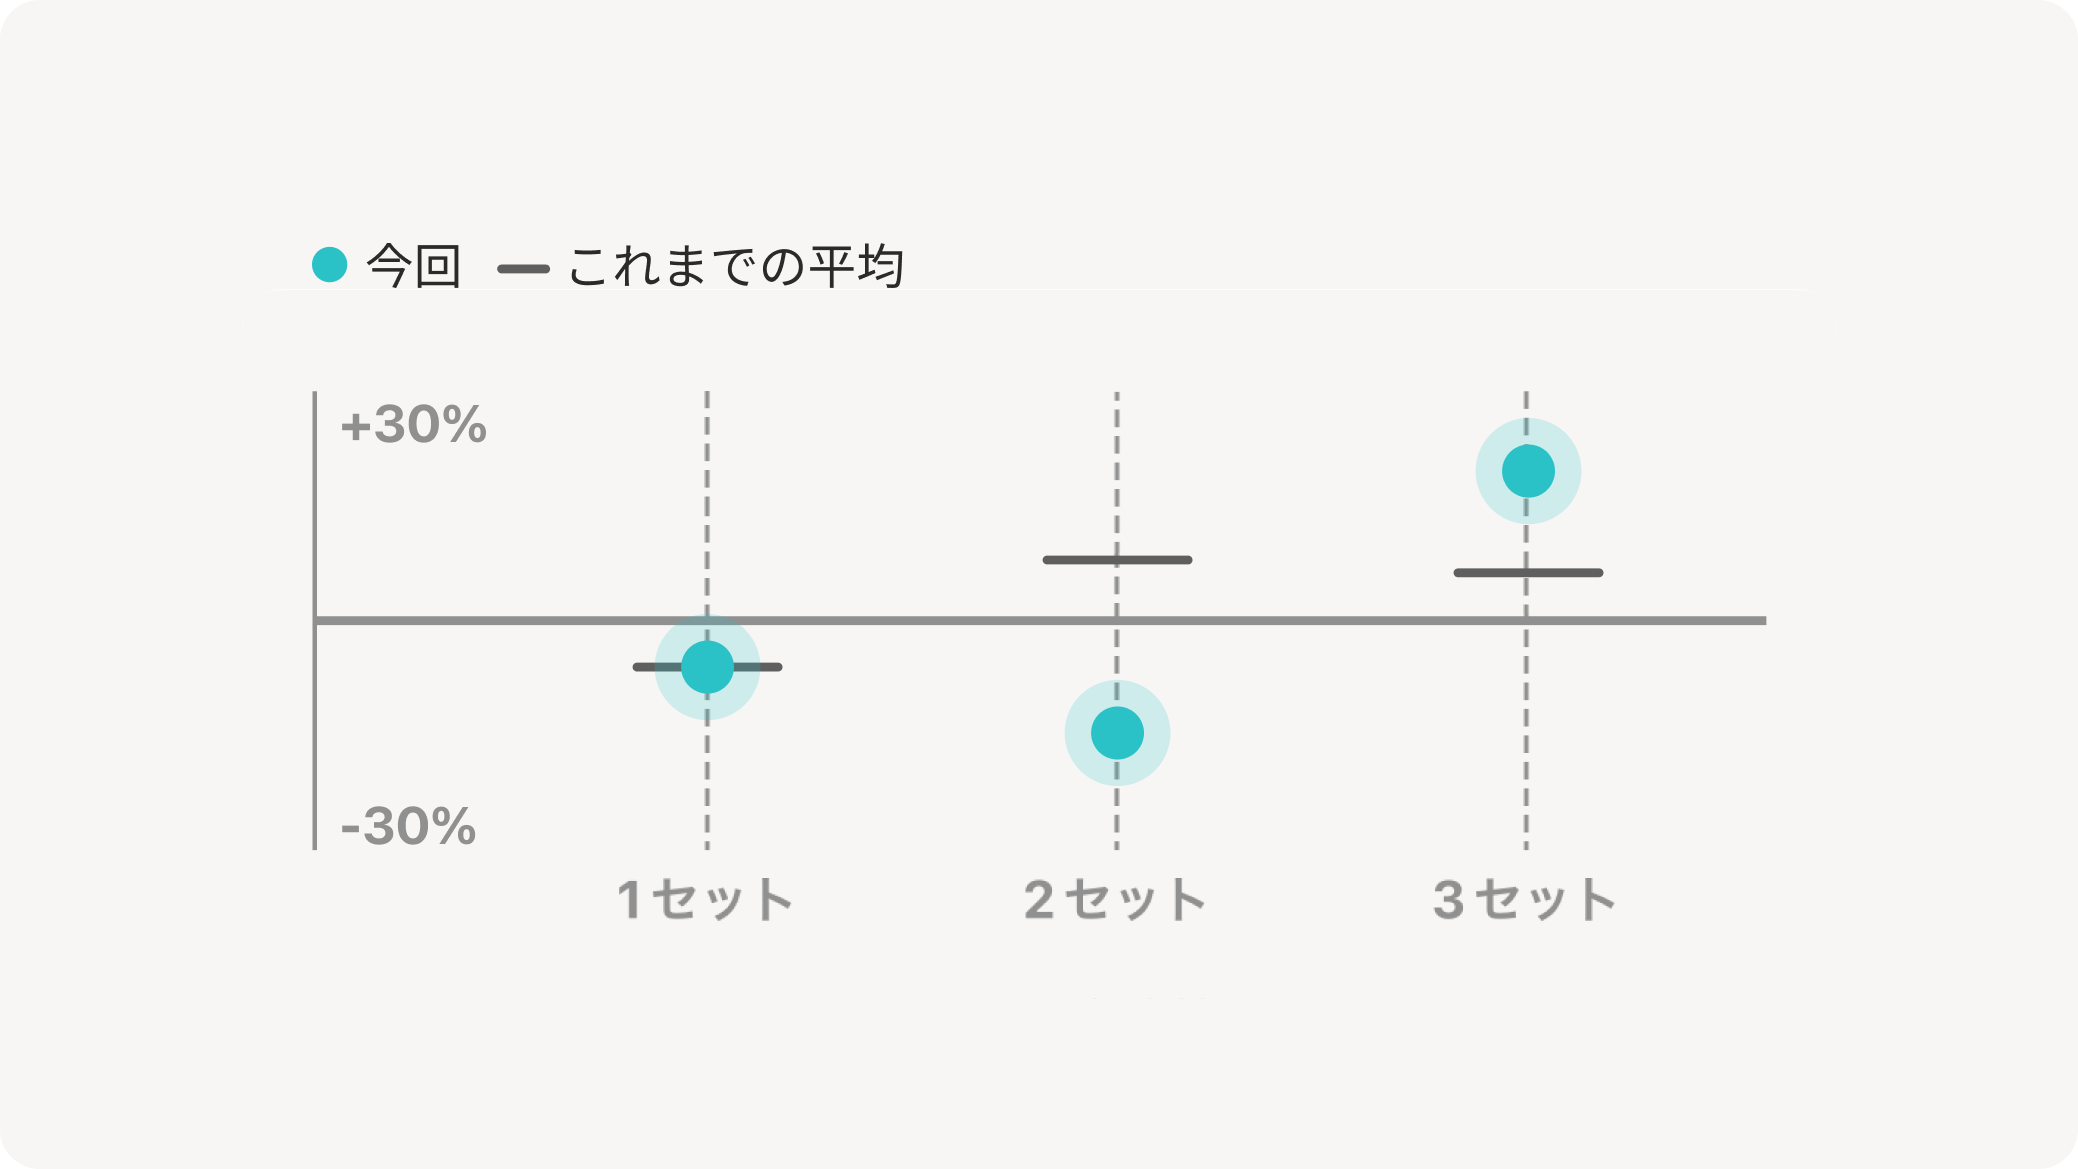
By comparing how much better or worse your ANS Performance was compared to your past self, you can gain new insights.
For example,
- By knowing the trends of your past and current bathing styles, you can objectively understand your habits and characteristics.
- By tracking changes when trying different bathing styles, it becomes easier to find the optimal routine that suits you.
- By comparing the differences between each Facility, it becomes easier to choose an environment that is comfortable and highly effective for you.
- Learning how your ANS Performance changes depending on your physical condition and level of fatigue that day.
Such explorations become possible. In other words, you can deepen your "personalized sauna experience" based on the data.
Please try various ways of taking a sauna and explore how your ANS Performance changes!