How to Read the Sleep Composition Graph
Aug 4, 2025
This page explains how to read and utilize the graphs.
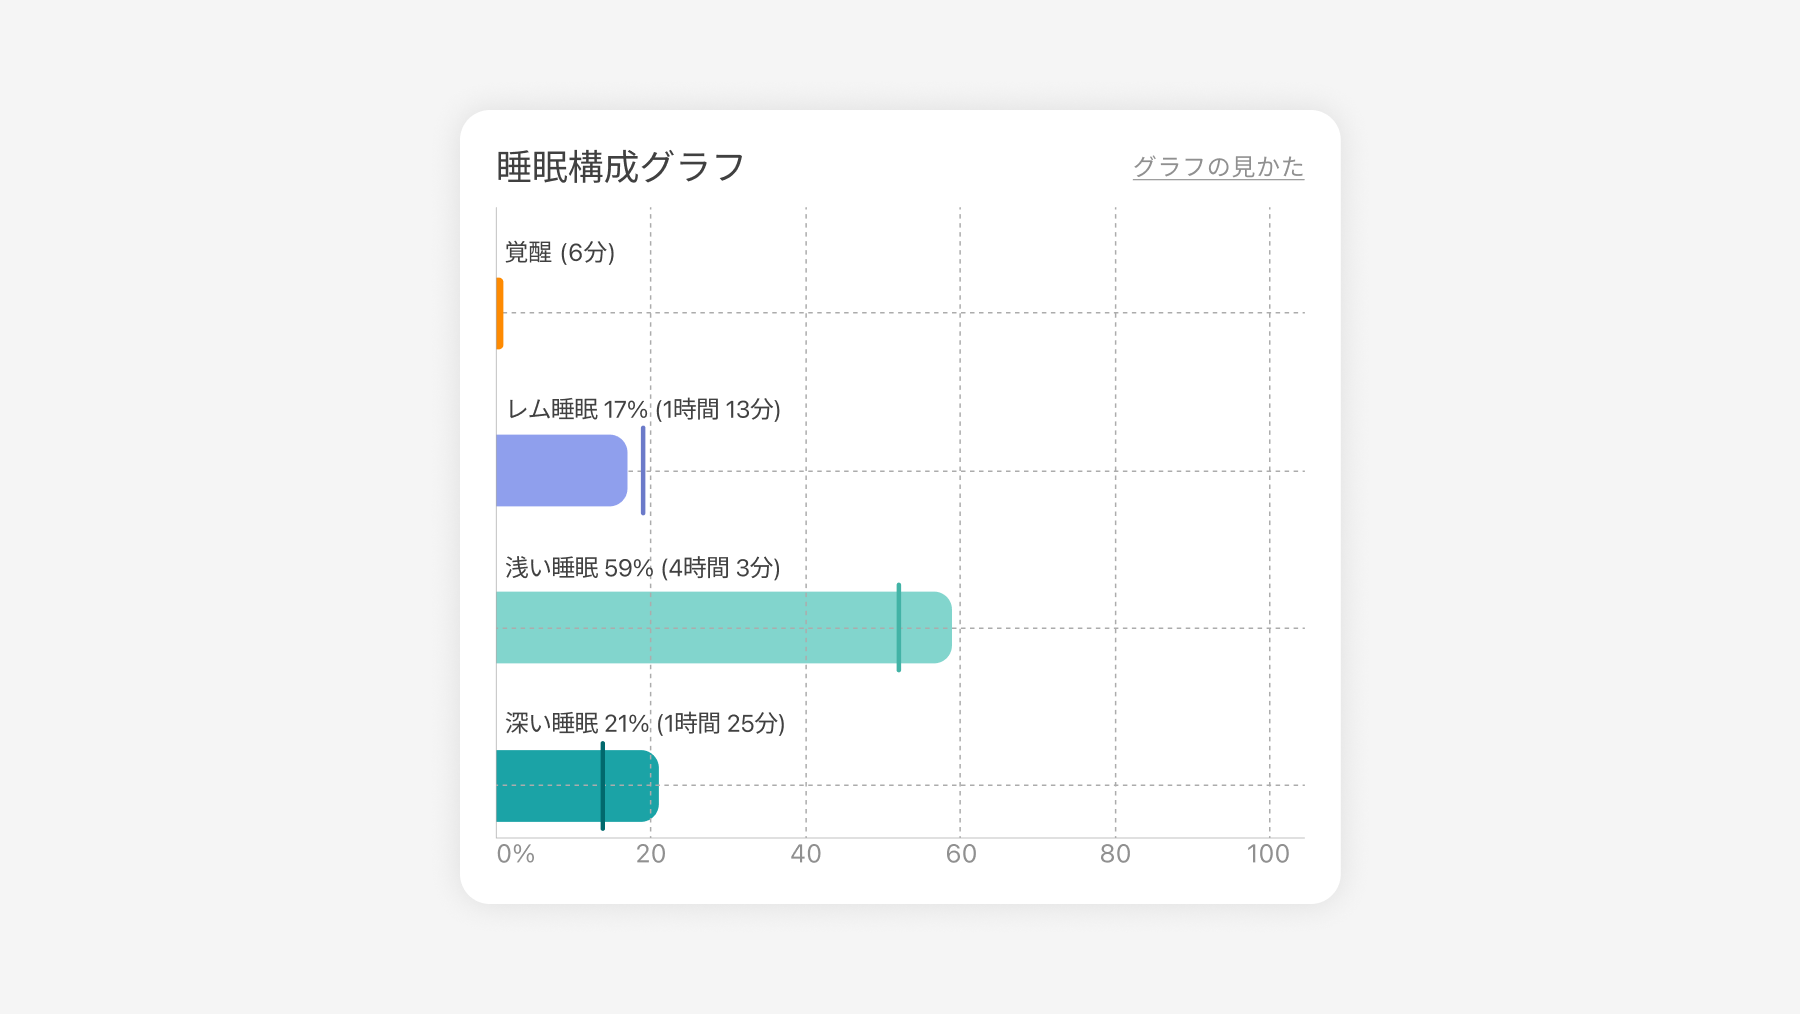
1. How to Read the Graphs
Sleep Composition Graph is a graph that visualizes the three components of your sleep, allowing you to check the balance.
The solid lines indicate the ideal ratios, allowing you to intuitively understand where your sleep is unbalanced.
1.1 Vertical and Horizontal Axes
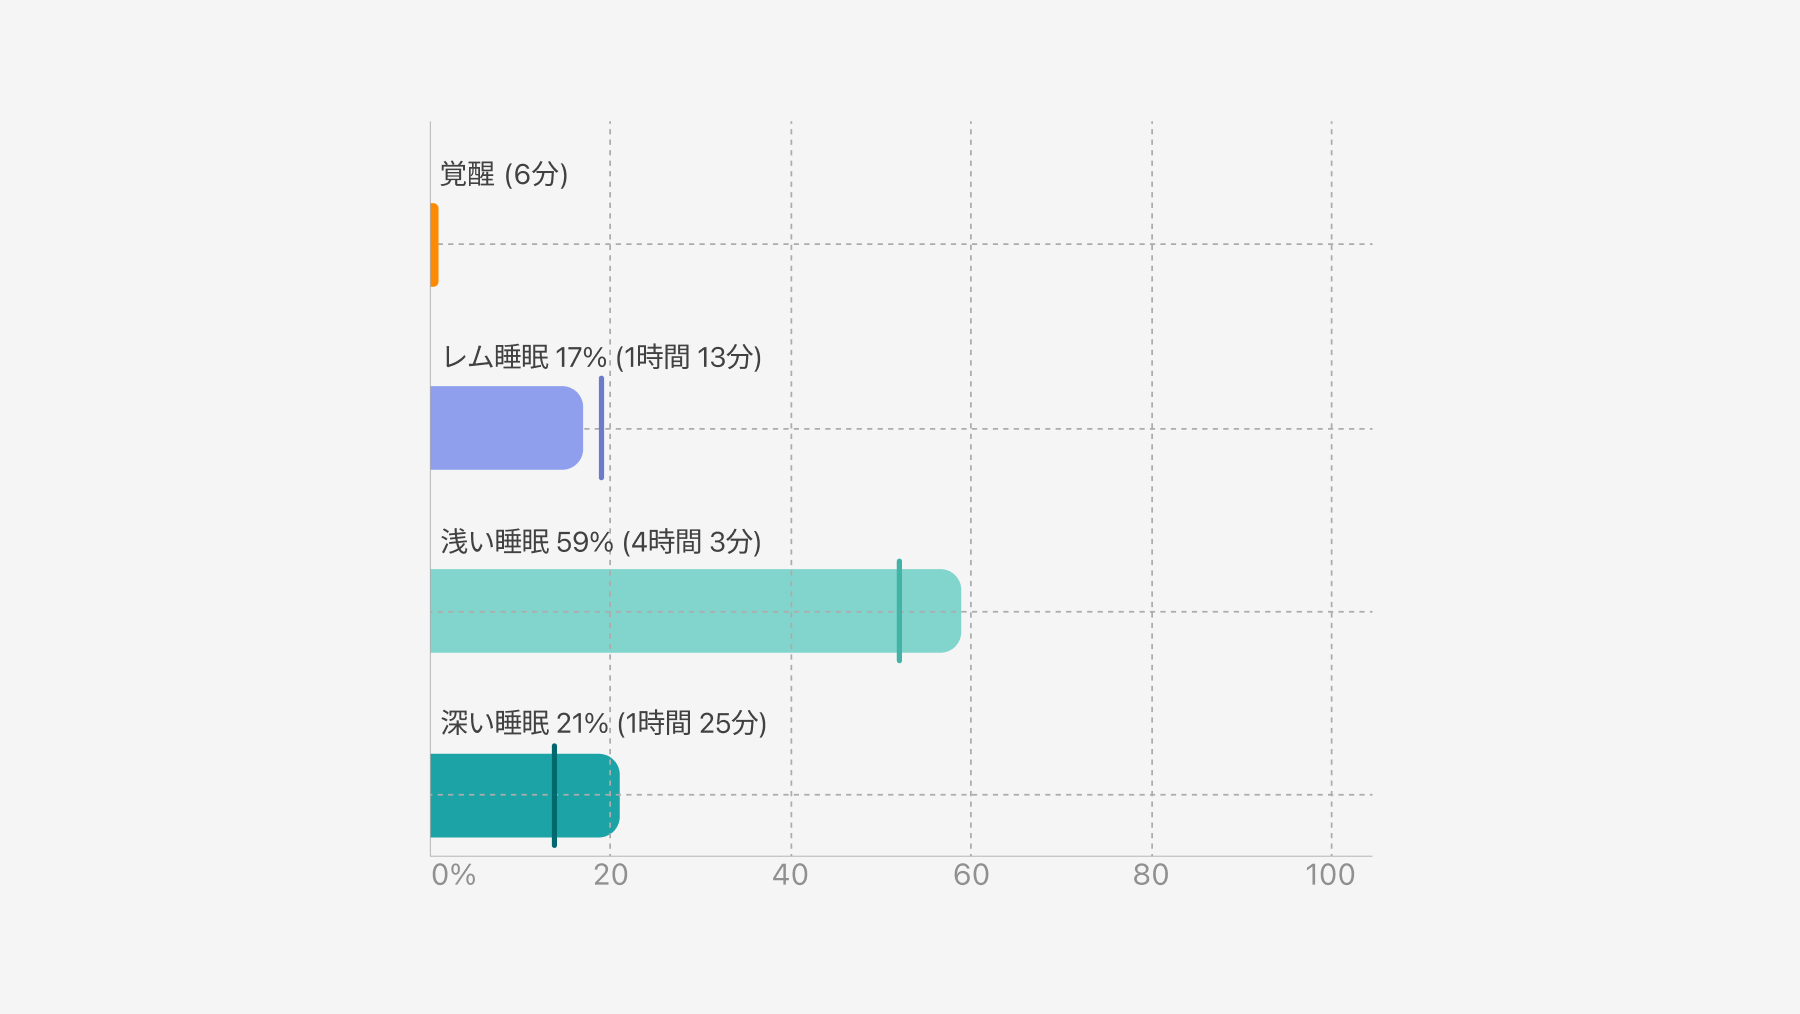
Vertical Axis: Components of Sleep
Four indicators from awake to deep sleep are displayed. Aim to reach the target ratio.
- Awake
Displays the duration and ratio of being awake during sleep.
- REM Sleep (Only displayed on SAWATCH-3)
Displays the duration and ratio of sleep said to be "involved in organizing and consolidating memory."
- Light Sleep
Displays the duration and ratio of sleep said to "play a role in connecting deep sleep and REM sleep."
- Deep Sleep
Displays the duration and ratio of sleep said to "enable physical recovery and growth."
Horizontal Axis: Proportion of each component
💡 Tips for Use
- Check your sleep balance with the graph
- Record your activities in "Sleep Memo"
- Compare days with good sleep and those without